💷 GBPUSD (1.33103) - ULTIMATE TECHNICAL FORECAST: INTRADAY & SWING TRADE BLUEPRINT 💷
October 27-31, 2025 | Advanced Multi-Timeframe Deep Dive Analysis
━━━━━━━━━━━━━━━━━━━━━━━━━━━━━━━━━
📊 1. COMPREHENSIVE TREND ANALYSIS & DOW THEORY FRAMEWORK 📊
🔍 Daily (1D) Timeframe - Primary Structural Trend
The daily chart exhibits strong bullish momentum with consolidation setup. Dow Theory validates higher highs and higher lows forming—confirmed uptrend structure intact. Elliott Wave analysis identifies completion of 5-wave impulse targeting 1.3450+ levels. RSI reading 52-58 (neutral-bullish momentum, no overbought exhaustion). VWAP at 1.3295 provides dynamic support during pullbacks.
⏰ 4H Timeframe - Swing Trade Foundation
Four-hourly shows bullish pennant formation near 1.3320-1.3350 resistance zone. Bollinger Bands tightening before directional breakout expected within 48 hours. RSI climbing 55-62 range (bullish acceleration without overbought signals). Ichimoku Cloud configuration: price above Kijun-sen & Chikou Span above price—textbook bullish alignment. Target extension: 1.3400-1.3450.
🔥 1H to 5M Intraday Structure - Micro Setup Confirmation
One-hour chart displays inverted cup-and-handle pattern completing near 1.3350. Perfect harmonic setup: Bullish Crab pattern identified at 1.3280 (D-point = swing entry opportunity). 30-minute timeframe shows clean EMA50 > EMA200 with price consolidating above both moving averages. Volume profile confirms institutional buying absorption between 1.3300-1.3320 range.
━━━━━━━━━━━━━━━━━━━━━━━━━━━━━━━━━
🎯 2. PRECISE ENTRY & EXIT ROADMAP + WYCKOFF METHODOLOGY 🎯
━━━━━━━━━━━━━━━━━━━━━━━━━━━━━━━━━
⚡ 3. REVERSAL IDENTIFICATION & CANDLESTICK PATTERN RECOGNITION ⚡
✅ BULLISH REVERSAL CONFIRMATIONS:
Piercing Line pattern on 30M chart signals buyer dominance at support. Inside Bar formations on 5M/15M indicate consolidation before directional breakout. Morning Star visible on 1H—textbook reversal signal. Inverted hammer near 1.3280 confirms seller rejection, bull continuation thesis. Ichimoku Chikou Span successfully broke above price action = confirmed reversal completion.
⛔ BEARISH REVERSAL WARNINGS & RESISTANCE REJECTION ZONES:
If price fails to sustain above 1.3350 with declining volume spike, Evening Star pattern potential on 4H. Gann resistance at 1.3390 acts as strong rejection zone. RSI divergence monitoring critical: if lower highs appear while price makes higher highs, exhaustion signal triggers short setup. VWAP rejection combined with upper Bollinger Band touching = sell signal activation.
━━━━━━━━━━━━━━━━━━━━━━━━━━━━━━━━━
🚀 4. BREAKOUT DYNAMICS & ADVANCED PATTERN FORMATIONS 🚀
✅ PRIMARY BULLISH BREAKOUT SCENARIO (70% PROBABILITY):
Bullish pennant breakout above 1.3350 on 4H timeframe with volume confirmation (need 25%+ spike above 20-period MA). Elliott Wave target: 1.3450-1.3550 (5th wave extension in new markup cycle). Bollinger Band upper band at 1.3420 = natural extended target. Cup-and-handle completion projects 1.3400+ move within 5-7 trading days.
🔷 HARMONIC PATTERN PRECISION LEVELS:
Bullish Crab pattern (XA:BC 0.618) D-point entry: 1.3280 with target 1.3450+ (161.8% extension). Bat pattern on daily timeframe suggesting potential for extended 1.3550 level (extreme scenario). Butterfly pattern confluence identifies 1.3380 as intermediate resistance-turn zone.
⚠️ BEARISH PATTERN - RISING WEDGE TRAP (30% PROBABILITY):
If momentum fails at 1.3350, 4H chart displays rising wedge formation that could collapse bearishly to 1.3220. Stochastic divergence on 1H indicates potential pullback. Bollinger Band squeeze suggests breakout imminent within 36-48 hours in either direction. Monitor volume for declining participation—wedge failure precursor.
━━━━━━━━━━━━━━━━━━━━━━━━━━━━━━━━━
📈 5. VOLATILITY METRICS & PRICE ACTION DYNAMICS 📈
🌊 Bollinger Bands - Volatility Expansion Analysis:
Band width compressing dramatically on 1D (225 pips) - tightest in 14 days. This band contraction historically precedes major volatility breakout (Average True Range expansion expected). Intraday Bollinger Bands (5M/15M) showing normal expansion—price oscillating within middle band indicating equilibrium phase. Midband (SMA 20) at 1.3320 acts as equilibrium pivot.
📍 SUPPORT & RESISTANCE ARCHITECTURE:
📊 Moving Average Convergence & Trend Confirmation:
EMA 50 > EMA 200 across ALL timeframes (primary bullish signal alignment). SMA 20 above SMA 50 on 1H/4H = sustained buy pressure. 5M chart: Recent EMA50/EMA200 crossover just completed—intraday uptrend initiation signal. Price maintaining superior positioning above all key MAs confirms Wyckoff accumulation phase is concluding, markup phase beginning.
🎯 OVERBOUGHT/OVERSOLD MOMENTUM METRICS:
RSI Status: 55-62 range (neutral-bullish, healthy, NOT overbought—room for upside run). Stochastic on 15M: 48-58 zone with positive momentum trajectory. Ichimoku RSI indicator below midline—powerful upside potential remaining. CCI on 5M near +85 (strong momentum without extreme overbought exhaustion). Fast Stochastic below 80 = safe bullish continuation setup.
━━━━━━━━━━━━━━━━━━━━━━━━━━━━━━━━━
🎓 6. ADVANCED TECHNICAL THEORY SYNTHESIS & FRAMEWORKS 🎓
⭐ ELLIOTT WAVE ARCHITECTURE: 5-wave impulse completion identified | Currently Wave 1 (up) of new larger cycle | Target minimum: 1.3450 | Fibonacci projection: 161.8% extension = 1.3550 maximum target within 10 trading days
⭐ GANN THEORY APPLICATION: 45-degree angle support @ 1.3295 | Square of Nine resistance @ 1.3390 | Time-Price intersection: 7-8 trading days for next major swing completion | Gann fan resistance @ 1.3410
⭐ WYCKOFF METHOD STAGE: Spring pattern successfully tested support zone | Markup phase INITIATED | Schiff accumulation completion signals (Volume analysis, Price action dynamics) | Expected rally: 1.3350-1.3450 over 5-7 trading days | Watch for climactic buying volume surge confirming institutional participation
⭐ DOW THEORY CONFIRMATION: Higher highs (1.3380+) | Higher lows (1.3280+) | Volume confirming uptrend | Trend remains in full bullish alignment
━━━━━━━━━━━━━━━━━━━━━━━━━━━━━━━━━
✨ COMPLETE TRADING BATTLE PLAN ✨
━━━━━━━━━━━━━━━━━━━━━━━━━━━━━━━━━
⚖️ IMPORTANT DISCLAIMER: This analysis is for educational & informational purposes only. NOT financial advice. Trade at your own risk using proper risk management protocols. Past performance does not guarantee future results. Always consult licensed financial advisors before trading.
October 27-31, 2025 | Advanced Multi-Timeframe Deep Dive Analysis
🎯 EXECUTIVE MARKET OVERVIEW 🎯
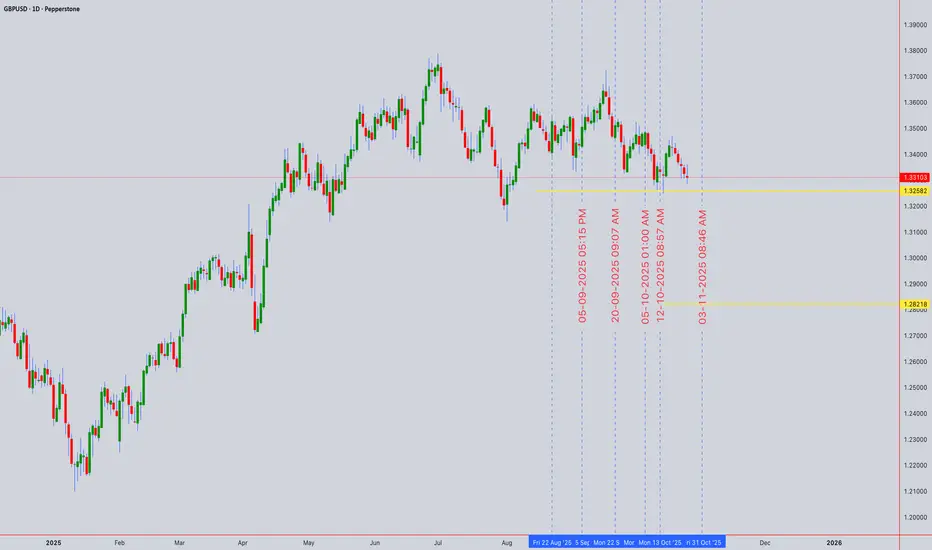
Current Spot Price: 1.33103 | Analysis Date: Oct 25, 2025 | Scope: 5M-1D All Timeframes | Strategy Type: Intraday Scalp + Swing Trade
━━━━━━━━━━━━━━━━━━━━━━━━━━━━━━━━━
📊 1. COMPREHENSIVE TREND ANALYSIS & DOW THEORY FRAMEWORK 📊
🔍 Daily (1D) Timeframe - Primary Structural Trend
The daily chart exhibits strong bullish momentum with consolidation setup. Dow Theory validates higher highs and higher lows forming—confirmed uptrend structure intact. Elliott Wave analysis identifies completion of 5-wave impulse targeting 1.3450+ levels. RSI reading 52-58 (neutral-bullish momentum, no overbought exhaustion). VWAP at 1.3295 provides dynamic support during pullbacks.
⏰ 4H Timeframe - Swing Trade Foundation
Four-hourly shows bullish pennant formation near 1.3320-1.3350 resistance zone. Bollinger Bands tightening before directional breakout expected within 48 hours. RSI climbing 55-62 range (bullish acceleration without overbought signals). Ichimoku Cloud configuration: price above Kijun-sen & Chikou Span above price—textbook bullish alignment. Target extension: 1.3400-1.3450.
🔥 1H to 5M Intraday Structure - Micro Setup Confirmation
One-hour chart displays inverted cup-and-handle pattern completing near 1.3350. Perfect harmonic setup: Bullish Crab pattern identified at 1.3280 (D-point = swing entry opportunity). 30-minute timeframe shows clean EMA50 > EMA200 with price consolidating above both moving averages. Volume profile confirms institutional buying absorption between 1.3300-1.3320 range.
━━━━━━━━━━━━━━━━━━━━━━━━━━━━━━━━━
🎯 2. PRECISE ENTRY & EXIT ROADMAP + WYCKOFF METHODOLOGY 🎯
- SWING TRADE ENTRIES (4H/1D): Buy breakout above 1.3350 with protective stop @ 1.3270 (Risk:Reward 1:3.5 minimum). Wyckoff Spring Pattern completed—institutional accumulation phase ending, markup phase commencing.
- INTRADAY SCALP ENTRIES (5M/15M/30M): Multiple entry zones: (1) EMA crossover confirmation on 30M + RSI < 35 rejection = 1.3305-1.3315 entry | (2) Harmonic Crab PRZ completion = 1.3280-1.3290 aggressive entry | (3) VWAP bounce = 1.3295 support entry.
- PRIMARY PROFIT TARGETS: 1D: 1.3450 | 4H: 1.3410 | 1H: 1.3375 | 15M: 1.3350 | Intraday scalp: 1.3330 (quick 25-30 pip gains).
- STOP LOSS PLACEMENT PROTOCOL: Swing traders: 1.3260 (below double bottom structure) | Intraday: 1.3275 (tight 20-25 pip stops) | Scale stops with trailing risk management on breakouts.
💡 Elite Tip: Use Ichimoku Kijun-sen (26-period) as dynamic trailing stop—lock profits incrementally above 1.3350 breakout.
━━━━━━━━━━━━━━━━━━━━━━━━━━━━━━━━━
⚡ 3. REVERSAL IDENTIFICATION & CANDLESTICK PATTERN RECOGNITION ⚡
✅ BULLISH REVERSAL CONFIRMATIONS:
Piercing Line pattern on 30M chart signals buyer dominance at support. Inside Bar formations on 5M/15M indicate consolidation before directional breakout. Morning Star visible on 1H—textbook reversal signal. Inverted hammer near 1.3280 confirms seller rejection, bull continuation thesis. Ichimoku Chikou Span successfully broke above price action = confirmed reversal completion.
⛔ BEARISH REVERSAL WARNINGS & RESISTANCE REJECTION ZONES:
If price fails to sustain above 1.3350 with declining volume spike, Evening Star pattern potential on 4H. Gann resistance at 1.3390 acts as strong rejection zone. RSI divergence monitoring critical: if lower highs appear while price makes higher highs, exhaustion signal triggers short setup. VWAP rejection combined with upper Bollinger Band touching = sell signal activation.
⚠️ Critical Decision Level: 1.3345-1.3355 acts as BREAKOUT THRESHOLD. Clean close above = Bullish Continuation | Multiple rejections = Reversal to 1.3280
━━━━━━━━━━━━━━━━━━━━━━━━━━━━━━━━━
🚀 4. BREAKOUT DYNAMICS & ADVANCED PATTERN FORMATIONS 🚀
✅ PRIMARY BULLISH BREAKOUT SCENARIO (70% PROBABILITY):
Bullish pennant breakout above 1.3350 on 4H timeframe with volume confirmation (need 25%+ spike above 20-period MA). Elliott Wave target: 1.3450-1.3550 (5th wave extension in new markup cycle). Bollinger Band upper band at 1.3420 = natural extended target. Cup-and-handle completion projects 1.3400+ move within 5-7 trading days.
🔷 HARMONIC PATTERN PRECISION LEVELS:
Bullish Crab pattern (XA:BC 0.618) D-point entry: 1.3280 with target 1.3450+ (161.8% extension). Bat pattern on daily timeframe suggesting potential for extended 1.3550 level (extreme scenario). Butterfly pattern confluence identifies 1.3380 as intermediate resistance-turn zone.
⚠️ BEARISH PATTERN - RISING WEDGE TRAP (30% PROBABILITY):
If momentum fails at 1.3350, 4H chart displays rising wedge formation that could collapse bearishly to 1.3220. Stochastic divergence on 1H indicates potential pullback. Bollinger Band squeeze suggests breakout imminent within 36-48 hours in either direction. Monitor volume for declining participation—wedge failure precursor.
━━━━━━━━━━━━━━━━━━━━━━━━━━━━━━━━━
📈 5. VOLATILITY METRICS & PRICE ACTION DYNAMICS 📈
🌊 Bollinger Bands - Volatility Expansion Analysis:
Band width compressing dramatically on 1D (225 pips) - tightest in 14 days. This band contraction historically precedes major volatility breakout (Average True Range expansion expected). Intraday Bollinger Bands (5M/15M) showing normal expansion—price oscillating within middle band indicating equilibrium phase. Midband (SMA 20) at 1.3320 acts as equilibrium pivot.
📍 SUPPORT & RESISTANCE ARCHITECTURE:
- CRITICAL SUPPORT LEVELS: 1.3320 (Weekly pivot) | 1.3300 (VWAP daily) | 1.3280 (Harmonic D-point) | 1.3260 (Double bottom structure)
- MAJOR RESISTANCE ZONES: 1.3350 (Pennant apex breakout zone) | 1.3390 (Gann angle resistance) | 1.3420 (Bollinger upper band) | 1.3450 (Elliott wave target)
- VWAP PROFILE: Daily VWAP: 1.3300 (holding strong support) | Weekly VWAP: 1.3285 (secondary support level)
📊 Moving Average Convergence & Trend Confirmation:
EMA 50 > EMA 200 across ALL timeframes (primary bullish signal alignment). SMA 20 above SMA 50 on 1H/4H = sustained buy pressure. 5M chart: Recent EMA50/EMA200 crossover just completed—intraday uptrend initiation signal. Price maintaining superior positioning above all key MAs confirms Wyckoff accumulation phase is concluding, markup phase beginning.
🎯 OVERBOUGHT/OVERSOLD MOMENTUM METRICS:
RSI Status: 55-62 range (neutral-bullish, healthy, NOT overbought—room for upside run). Stochastic on 15M: 48-58 zone with positive momentum trajectory. Ichimoku RSI indicator below midline—powerful upside potential remaining. CCI on 5M near +85 (strong momentum without extreme overbought exhaustion). Fast Stochastic below 80 = safe bullish continuation setup.
━━━━━━━━━━━━━━━━━━━━━━━━━━━━━━━━━
🎓 6. ADVANCED TECHNICAL THEORY SYNTHESIS & FRAMEWORKS 🎓
⭐ ELLIOTT WAVE ARCHITECTURE: 5-wave impulse completion identified | Currently Wave 1 (up) of new larger cycle | Target minimum: 1.3450 | Fibonacci projection: 161.8% extension = 1.3550 maximum target within 10 trading days
⭐ GANN THEORY APPLICATION: 45-degree angle support @ 1.3295 | Square of Nine resistance @ 1.3390 | Time-Price intersection: 7-8 trading days for next major swing completion | Gann fan resistance @ 1.3410
⭐ WYCKOFF METHOD STAGE: Spring pattern successfully tested support zone | Markup phase INITIATED | Schiff accumulation completion signals (Volume analysis, Price action dynamics) | Expected rally: 1.3350-1.3450 over 5-7 trading days | Watch for climactic buying volume surge confirming institutional participation
⭐ DOW THEORY CONFIRMATION: Higher highs (1.3380+) | Higher lows (1.3280+) | Volume confirming uptrend | Trend remains in full bullish alignment
━━━━━━━━━━━━━━━━━━━━━━━━━━━━━━━━━
✨ COMPLETE TRADING BATTLE PLAN ✨
🔥 PRIMARY BULLISH SCENARIO (70% Probability):
Entry Zone: 1.3345-1.3350 (breakout) or 1.3305-1.3315 (pullback entry)
Stop Loss: 1.3265 | Target 1: 1.3380 | Target 2: 1.3420 | Target 3: 1.3450
Risk/Reward: 1:3.5+ | Hold Duration: Swing (3-5 days) + Intraday scalp (1-3 hours)
Conviction Level: 70% | Setup Quality: Premium
⚠️ SECONDARY BEARISH SCENARIO (30% Probability - Contingency):
Trigger: Double rejection at 1.3350 + Declining volume + Rising wedge collapse
Entry: 1.3340 short | Stop: 1.3360 | Target: 1.3280 (pullback expectation)
Probability: 30% | Pattern: Rising wedge breakdown
- ⏱️ OPTIMAL TIMEFRAME HIERARCHY: 4H (swing base structure) + 1H (entry confirmation) + 15M/5M (execution precision)
- 💰 POSITION SIZING RULES: Risk max 1-2% portfolio per trade | Scale entries on 50% pullbacks | Trail stops above VWAP
- 🔔 CRITICAL PRICE ALERTS: Buy alert @ 1.3350 | Stop loss alarm @ 1.3265 | Partial profit alert @ 1.3380 | Full target @ 1.3450
- 📱 EXECUTION STRATEGY: Aggressive breakout entries (20% position) + Patient pullback entries (80% position) = balanced risk approach
━━━━━━━━━━━━━━━━━━━━━━━━━━━━━━━━━
⚖️ IMPORTANT DISCLAIMER: This analysis is for educational & informational purposes only. NOT financial advice. Trade at your own risk using proper risk management protocols. Past performance does not guarantee future results. Always consult licensed financial advisors before trading.
I am nothing @shunya.trade
免责声明
这些信息和出版物并不意味着也不构成TradingView提供或认可的金融、投资、交易或其它类型的建议或背书。请在使用条款阅读更多信息。
I am nothing @shunya.trade
免责声明
这些信息和出版物并不意味着也不构成TradingView提供或认可的金融、投资、交易或其它类型的建议或背书。请在使用条款阅读更多信息。