This chart forms part of a larger research note. None of the information posted here (TV) should be considered financial advice.
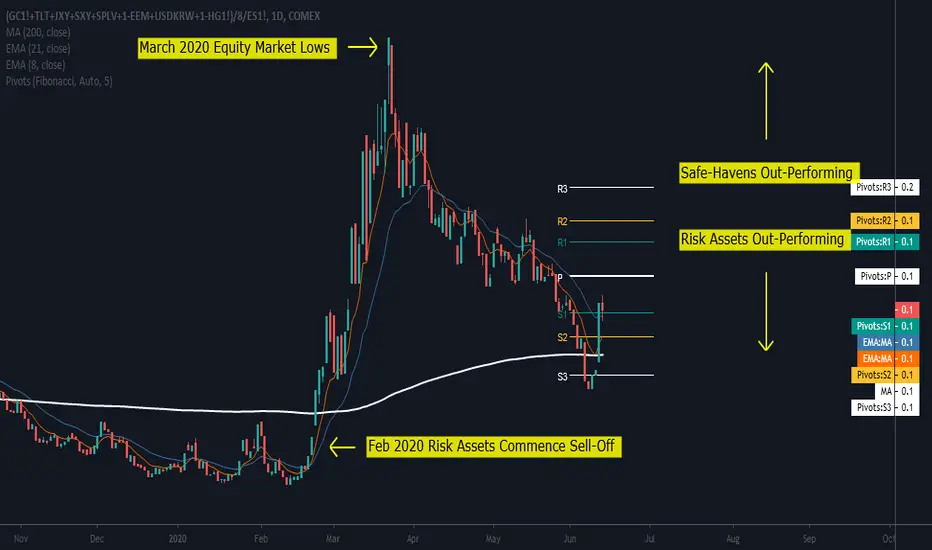
On a relative basis, safe-havens have out-performed risk assets for the past week. This is highlighted by the relative chart, using our custom Global Safe-Haven Index (SHIX) versus the S&P500 E-mini Futures (as a wide proxy for risk assets). Support was found on support level 3 (S3) as well as the flat 200-day simple moving average. The last close (Friday, 12 June) has seen the relative price closing above both the 8 and 21-day exponential moving average, both of which have started to lose downside momentum. Going forward (with a short to medium term view), I am expecting the Global Safe-Haven Index to challenge risk assets.
On a relative basis, safe-havens have out-performed risk assets for the past week. This is highlighted by the relative chart, using our custom Global Safe-Haven Index (SHIX) versus the S&P500 E-mini Futures (as a wide proxy for risk assets). Support was found on support level 3 (S3) as well as the flat 200-day simple moving average. The last close (Friday, 12 June) has seen the relative price closing above both the 8 and 21-day exponential moving average, both of which have started to lose downside momentum. Going forward (with a short to medium term view), I am expecting the Global Safe-Haven Index to challenge risk assets.
免责声明
这些信息和出版物并非旨在提供,也不构成TradingView提供或认可的任何形式的财务、投资、交易或其他类型的建议或推荐。请阅读使用条款了解更多信息。
免责声明
这些信息和出版物并非旨在提供,也不构成TradingView提供或认可的任何形式的财务、投资、交易或其他类型的建议或推荐。请阅读使用条款了解更多信息。