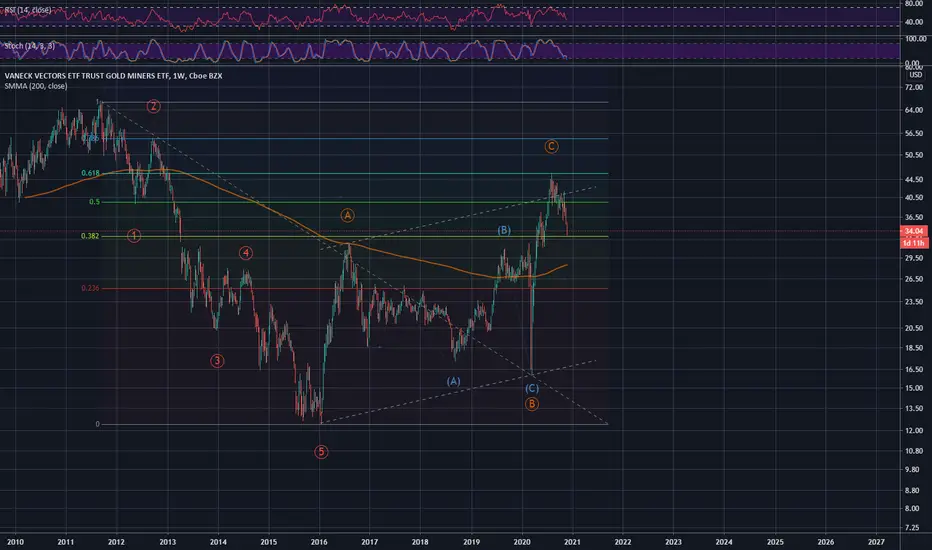
On the chart we see nice 5 wave move down from 2011 till 2016 followed by 61% running flat correction topped in Aug this year. This probably can give us some clue on whether the following Gold price fall is a short term correction or a beginning of a long term down trend. I would bet the latter.
免责声明
这些信息和出版物并不意味着也不构成TradingView提供或认可的金融、投资、交易或其它类型的建议或背书。请在使用条款阅读更多信息。