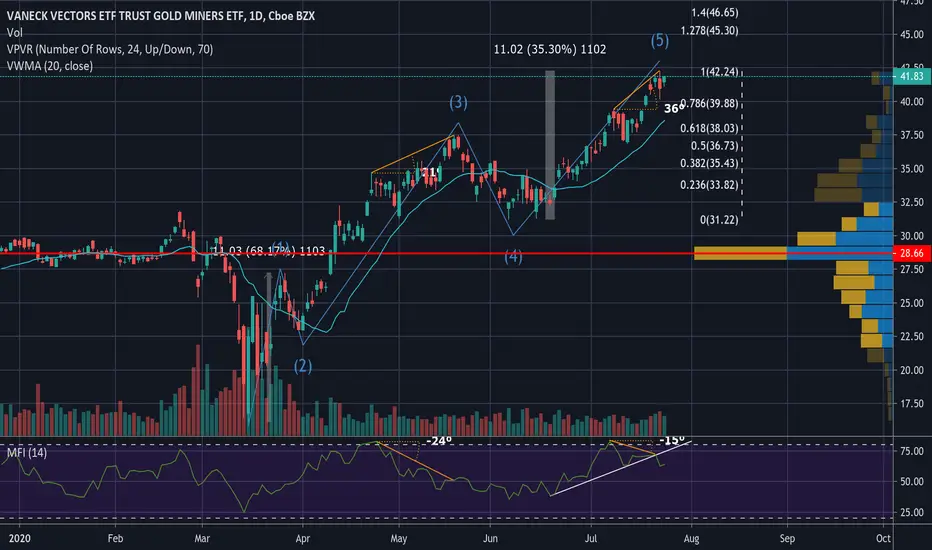
GDX has been on a good run and is showing signs of topping out. Specifically bearish divergence is clear on MFI (money flow index [similar to RSI but also account for volume] and we see a clear 5 wave pattern in the context of Elliot Wave analysis with wave 5 almost exactly equal to wave 1 which is a component of wave analysis. For those who want to short you must establish your own stop loss and a reasonable first target is the low 38 regions based on a .618 retracement of the 5th wave and this also correlates to where the volume weighted moving average is. I would also not be surprised to see a corrective ABC pattern play out.
免责声明
这些信息和出版物并不意味着也不构成TradingView提供或认可的金融、投资、交易或其它类型的建议或背书。请在使用条款阅读更多信息。