GLENMMAR PHARMACUITCAL- Bullish Flag & Pole Breakout (Daily T/F)
Trade Setup
📌 Stock: GLENMARK PHARMACUITICALS ( GLENMARK )
📌 Trend: Strong Bullish Momentum
📌 Risk-Reward Ratio: 1:3 (Favorable)
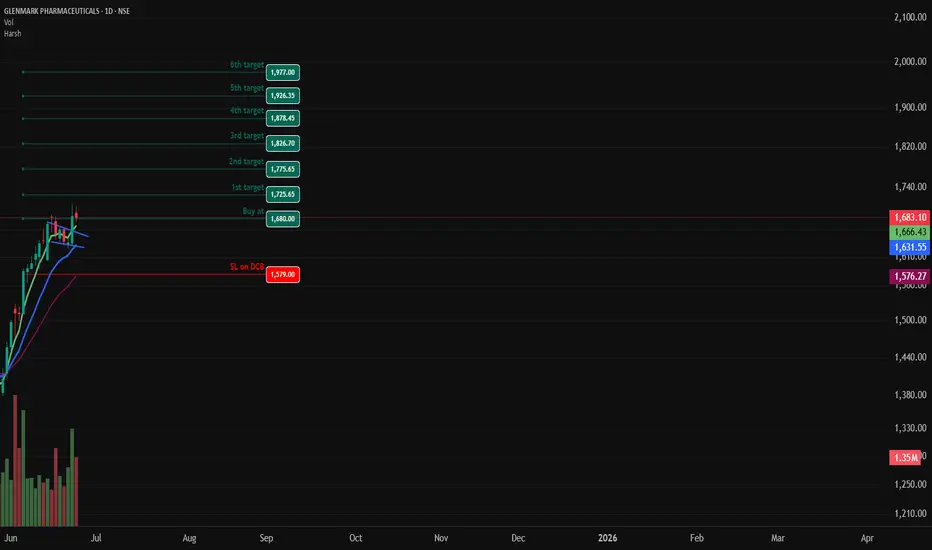
🎯 Entry Zone: ₹1680.00 (Breakout Confirmation)
🛑 Stop Loss: ₹1579.00 (Daily Closing Basis) (-6 % Risk)
🎯 Target Levels:
₹1725.65
₹1775.65
₹1826.70
₹1878.45
₹1926.35
₹1977.00 (Final Target)
Technical Rationale
✅ Bullish Flag & Pole Breakout - Classic bullish pattern confirming uptrend continuation
✅ Strong Momentum - Daily RSI > 60, Weekly RSI >60 Monthly rsi >60
✅ Volume Confirmation - Breakout volume 1.93M vs previous day's 1.16M
✅ Multi-Timeframe Alignment - Daily and weekly charts showing strength
Key Observations
• The breakout comes with significantly higher volume, validating strength
• Well-defined pattern with clear price & volume breakout
• Conservative stop loss at recent swing low
Trade Management Strategy
• Consider partial profit booking at each target level
• Move stop loss to breakeven after Target 1 is achieved
• Trail stop loss to protect profits as price progresses
Disclaimer ⚠️
This analysis is strictly for educational purposes and should not be construed as financial advice. Trading in equities involves substantial risk of capital loss. Past performance is not indicative of future results. Always conduct your own research, consider your risk appetite, and consult a financial advisor before making any investment decisions. The author assumes no responsibility for any trading outcomes based on this information.
What do you think? Are you watchingGLENMARK for this breakout opportunity? Share your views in the comments!
📌 Stock: GLENMARK PHARMACUITICALS (
📌 Trend: Strong Bullish Momentum
📌 Risk-Reward Ratio: 1:3 (Favorable)
🎯 Entry Zone: ₹1680.00 (Breakout Confirmation)
🛑 Stop Loss: ₹1579.00 (Daily Closing Basis) (-6 % Risk)
🎯 Target Levels:
₹1725.65
₹1775.65
₹1826.70
₹1878.45
₹1926.35
₹1977.00 (Final Target)
Technical Rationale
✅ Bullish Flag & Pole Breakout - Classic bullish pattern confirming uptrend continuation
✅ Strong Momentum - Daily RSI > 60, Weekly RSI >60 Monthly rsi >60
✅ Volume Confirmation - Breakout volume 1.93M vs previous day's 1.16M
✅ Multi-Timeframe Alignment - Daily and weekly charts showing strength
Key Observations
• The breakout comes with significantly higher volume, validating strength
• Well-defined pattern with clear price & volume breakout
• Conservative stop loss at recent swing low
Trade Management Strategy
• Consider partial profit booking at each target level
• Move stop loss to breakeven after Target 1 is achieved
• Trail stop loss to protect profits as price progresses
Disclaimer ⚠️
This analysis is strictly for educational purposes and should not be construed as financial advice. Trading in equities involves substantial risk of capital loss. Past performance is not indicative of future results. Always conduct your own research, consider your risk appetite, and consult a financial advisor before making any investment decisions. The author assumes no responsibility for any trading outcomes based on this information.
What do you think? Are you watching
交易开始
1st Target Completed...............注释
2nd Target Completed................相关出版物
免责声明
这些信息和出版物并非旨在提供,也不构成TradingView提供或认可的任何形式的财务、投资、交易或其他类型的建议或推荐。请阅读使用条款了解更多信息。