1. Technical pattern
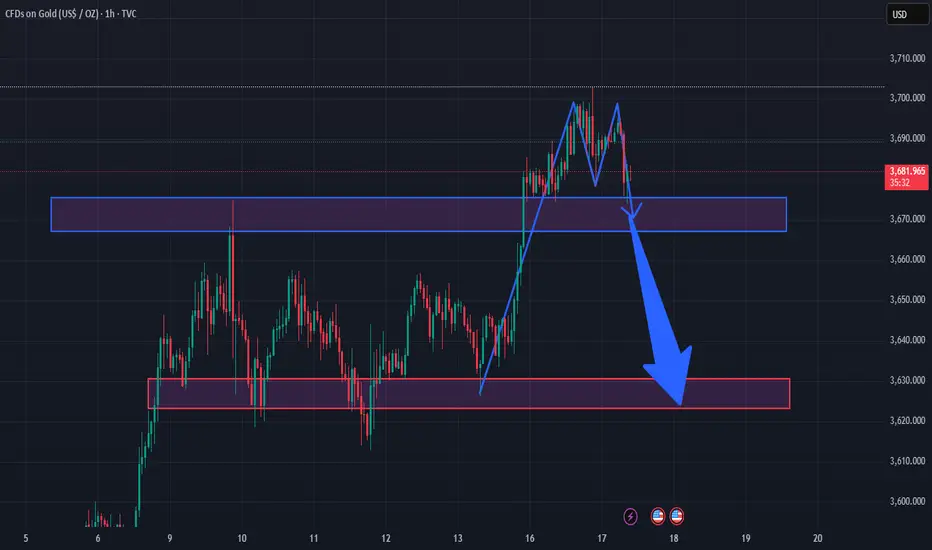
The gold chart (XAU/USD, H1 frame) is showing a Double Top pattern (2 peaks) - this is a classic bearish reversal pattern.
After creating 2 peaks around the 3,700 area, the price has turned down to the support area.
2. Important areas
Short-term resistance: around 3,695 - 3,705 (old peak).
Nearby support: 3,670 - 3,675 area (blue box). This is the neckline of the Double Top pattern.
Next strong support: 3,630 - 3,640 area (red box). This is the area where the price has maintained the previous uptrend.
3. Price scenario
If the price maintains the blue box (does not break the neckline) → it can bounce back to test the 3,695 - 3,705 area.
If the price breaks through the green box with strong volume → confirms the completion of the Double Top pattern, it is likely to fall to the red box 3,630 - 3,640.
The short-term trend is leaning towards bearish (down) due to the appearance of a reversal pattern.
4. Trading suggestions
Sell when the price clearly breaks through 3,670 - 3,675.
Take profit around 3,630 - 3,640.
Stop loss above the nearest peak 3,705 to limit risk.
👉 Summary: This chart is leaning towards a bearish scenario. Neckline 3,670 - 3,675 is the key to confirm the Double Top pattern.
✅MY FREE FOREX & XAUUSD SIGNALS TELEGRAM CHANNEL:
t.me/Jenny_in_your_area
🔴9-12 signals per day
🔴Free knowledge support
🔴24/7 support for newbies.
🔴You always have priority.
JENDA FISH 😘
t.me/Jenny_in_your_area
🔴9-12 signals per day
🔴Free knowledge support
🔴24/7 support for newbies.
🔴You always have priority.
JENDA FISH 😘
相关出版物
免责声明
这些信息和出版物并不意味着也不构成TradingView提供或认可的金融、投资、交易或其它类型的建议或背书。请在使用条款阅读更多信息。