🔹 Technical Analysis Of XAUUSD
▪Current Market Overview
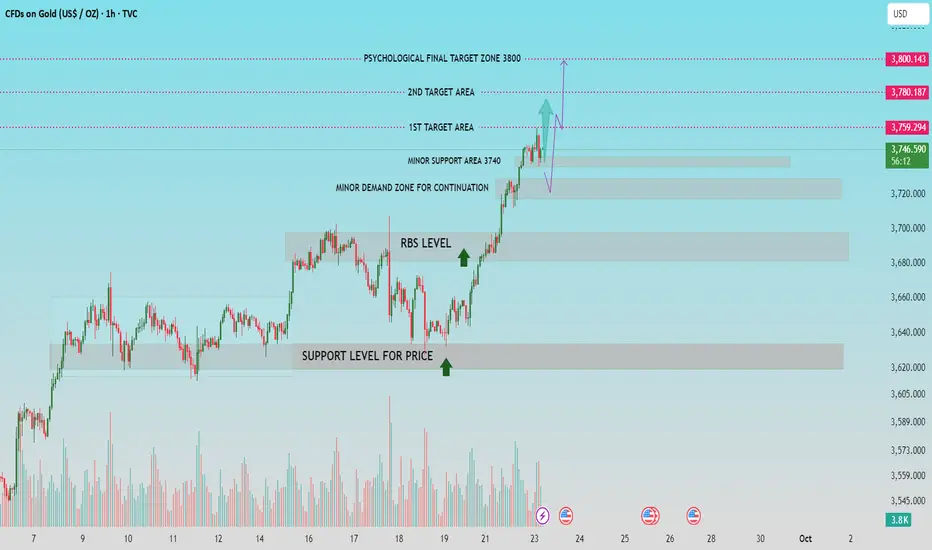
* Current Price: $3,743.84
* Trend Bias: Bullish
* Volume: Increasing during bullish breaks, confirming buying strength.
* Gold has recently broken out of a consolidation range and is forming higher highs and higher lows, indicating strong bullish momentum.
🔍 Key Technical Levels
✅ Support Zones (Buyers' Areas)
1. Minor Support Area – $3,740
* Recently formed after the breakout.
* Acts as immediate support and potential entry zone for buyers on retracement.
2. Minor Demand Zone – $3,720 to $3,700
* This area is crucial for continuation.
* If the price dips, a bounce from here confirms strong buyer interest.
3. RBS Level (Resistance Became Support) – $3,700
* A textbook RBS flip — resistance now turned support.
* Historically a zone where sellers lost control and buyers took over.
4. Major Support Zone – Around $3,640
* Strong base area, previous accumulation zone.
* If price drops here, it would be a deeper retracement but still within an uptrend context.
🎯 Target Zones (Resistance/Profit Areas)
1. 1st Target Area – $3,759
* Very close to the current price.
* Could act as a short-term barrier; minor rejection is possible.
2. 2nd Target Area – $3,780
* Key resistance zone, price could consolidate or react here.
* Consider partial profit booking if already in a long position.
3. Psychological Final Target – $3,800
* A strong psychological barrier.
* Often used by institutional traders for final targets.
* Break above this level may trigger a larger rally.
🧭 Trading Outlook & Scenarios
🟢 Bullish Scenario:
* If price holds above $3,740 and maintains structure:
* Expect continuation towards $3,759 → $3,780 → $3,800.
* Ideal entry on pullback to $3,740 or deeper into $3,720 zone, with tight stop below $3,700.
🔴 Bearish/Correction Scenario:
* If price fails to hold $3,740 and breaks below $3,700:
* Could initiate deeper correction toward $3,640.
* Would signal a short-term trend shift or consolidation phase.
📌 Volume Analysis
* Rising volume supports the breakout above resistance levels.
* Watch for volume drop near resistance — it could signal exhaustion.
⚠ Risk Management Note
* Avoid chasing price near resistance zones.
* Look for price confirmation at support zones for entry.
* Always use stop-loss below recent structure lows (e.g., below $3,700 or $3,640 depending on entry zone).
If this helpful for you, press the like button.
▪Current Market Overview
* Current Price: $3,743.84
* Trend Bias: Bullish
* Volume: Increasing during bullish breaks, confirming buying strength.
* Gold has recently broken out of a consolidation range and is forming higher highs and higher lows, indicating strong bullish momentum.
🔍 Key Technical Levels
✅ Support Zones (Buyers' Areas)
1. Minor Support Area – $3,740
* Recently formed after the breakout.
* Acts as immediate support and potential entry zone for buyers on retracement.
2. Minor Demand Zone – $3,720 to $3,700
* This area is crucial for continuation.
* If the price dips, a bounce from here confirms strong buyer interest.
3. RBS Level (Resistance Became Support) – $3,700
* A textbook RBS flip — resistance now turned support.
* Historically a zone where sellers lost control and buyers took over.
4. Major Support Zone – Around $3,640
* Strong base area, previous accumulation zone.
* If price drops here, it would be a deeper retracement but still within an uptrend context.
🎯 Target Zones (Resistance/Profit Areas)
1. 1st Target Area – $3,759
* Very close to the current price.
* Could act as a short-term barrier; minor rejection is possible.
2. 2nd Target Area – $3,780
* Key resistance zone, price could consolidate or react here.
* Consider partial profit booking if already in a long position.
3. Psychological Final Target – $3,800
* A strong psychological barrier.
* Often used by institutional traders for final targets.
* Break above this level may trigger a larger rally.
🧭 Trading Outlook & Scenarios
🟢 Bullish Scenario:
* If price holds above $3,740 and maintains structure:
* Expect continuation towards $3,759 → $3,780 → $3,800.
* Ideal entry on pullback to $3,740 or deeper into $3,720 zone, with tight stop below $3,700.
🔴 Bearish/Correction Scenario:
* If price fails to hold $3,740 and breaks below $3,700:
* Could initiate deeper correction toward $3,640.
* Would signal a short-term trend shift or consolidation phase.
📌 Volume Analysis
* Rising volume supports the breakout above resistance levels.
* Watch for volume drop near resistance — it could signal exhaustion.
⚠ Risk Management Note
* Avoid chasing price near resistance zones.
* Look for price confirmation at support zones for entry.
* Always use stop-loss below recent structure lows (e.g., below $3,700 or $3,640 depending on entry zone).
If this helpful for you, press the like button.
交易开始
注释
from minor support level 3740,注释
1st target achieved, 200 pips+ 注释
2nd target achieved, 3780, 400 pips+注释
注释
price gave respect to minor demand zone, 400 pips+ secured.交易结束:到达目标
800 pips+ achieved from minor demand zone 💸FREE FOREX Signals in Telegram : t.me/FxInsightsHub0
🔹Join Our Telegram Channel, Pure Price Action Based Signals With Chart Analysis.
t.me/FxInsightsHub0
🚀FREE CRYPTO Signals In Telegram: t.me/FxInsightsHub0
🔹Join Our Telegram Channel, Pure Price Action Based Signals With Chart Analysis.
t.me/FxInsightsHub0
🚀FREE CRYPTO Signals In Telegram: t.me/FxInsightsHub0
相关出版物
免责声明
这些信息和出版物并不意味着也不构成TradingView提供或认可的金融、投资、交易或其它类型的建议或背书。请在使用条款阅读更多信息。
💸FREE FOREX Signals in Telegram : t.me/FxInsightsHub0
🔹Join Our Telegram Channel, Pure Price Action Based Signals With Chart Analysis.
t.me/FxInsightsHub0
🚀FREE CRYPTO Signals In Telegram: t.me/FxInsightsHub0
🔹Join Our Telegram Channel, Pure Price Action Based Signals With Chart Analysis.
t.me/FxInsightsHub0
🚀FREE CRYPTO Signals In Telegram: t.me/FxInsightsHub0
相关出版物
免责声明
这些信息和出版物并不意味着也不构成TradingView提供或认可的金融、投资、交易或其它类型的建议或背书。请在使用条款阅读更多信息。