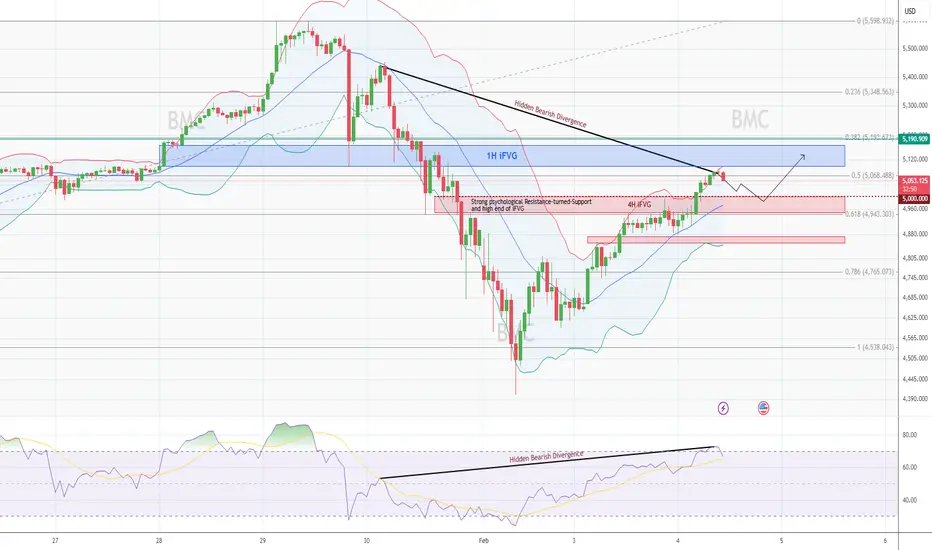
Gold Analysis (1H Chart)
Gold rose more than 2.5% during the early Asian session on Wednesday, and made highs of 5081.25
Although to test the mentioned highs, it has exhausted much of its strength
The bullish price action is getting weak, forming smaller candles than previous, with falling volumes every next candle
And the prices have entered the overbought zone on the 1H chart:
- Prices are testing the upper Bollinger band
- RSI is also trending above 70 levels and turning
- A hidden bearish divergence could also be identified on the 1H chart
Projection
- Thus, a moderate downside correction cannot be neglected towards the marked red zone (5000-4950): The resistance turned support or iFVG
- After which prices might continue the bullish trend towards the blue zone (1H iFVG between 5100-5170).
免责声明
这些信息和出版物并非旨在提供,也不构成TradingView提供或认可的任何形式的财务、投资、交易或其他类型的建议或推荐。请阅读使用条款了解更多信息。
免责声明
这些信息和出版物并非旨在提供,也不构成TradingView提供或认可的任何形式的财务、投资、交易或其他类型的建议或推荐。请阅读使用条款了解更多信息。