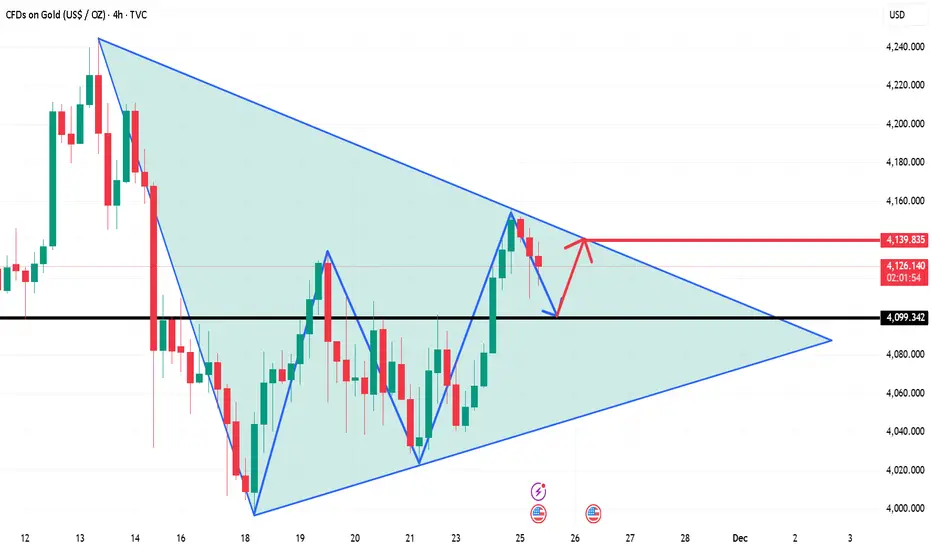
Gold hourly chart: Overnight, it rose steadily, and in the Asian session today, it initially continued its upward trend, reaching a high of 4156. However, due to the recent period of consolidation, the continuity of gains has been relatively weak. The initial rise suggests a potential pullback in the afternoon or European session, with a likely scenario of a correction based on the 4150-4160 resistance zone. This prediction ultimately materialized, with the price falling to a low of 4109, close to the 38.3% Fibonacci retracement level of yesterday's gains at 4111. The European session saw a further decline, breaking below the Asian session low. Any subsequent rebound should not be viewed as a bullish trap. Furthermore, based on today's high and low points, 4138 represents the 61.8% Fibonacci retracement level, currently acting as resistance. The best option for the US session is to wait. The next move will likely be a second downward pressure, either stabilizing at 4109 to form a double bottom, or breaking through it to confirm the 4104 annual moving average, or stabilizing at 4097 (50% retracement support) for a bullish move. These two levels also correspond to the short-term 5-day and 10-day support levels on the daily chart. Resistance is at 4138-4140. A break above this level would mean holding above the 10-day moving average, making further declines less likely and potentially pushing higher to test the 4150-4160 high. The key level is 4097. Trading above this level suggests a slightly bullish bias, while trading below it would indicate a weaker bias and a higher likelihood of wide-ranging price swings.
The road to success is not crowded. As long as you choose the right direction and follow the right team, you will be able to move forward.
t.me/david_456654
t.me/david_456654
相关出版物
免责声明
这些信息和出版物并非旨在提供,也不构成TradingView提供或认可的任何形式的财务、投资、交易或其他类型的建议或推荐。请阅读使用条款了解更多信息。
The road to success is not crowded. As long as you choose the right direction and follow the right team, you will be able to move forward.
t.me/david_456654
t.me/david_456654
相关出版物
免责声明
这些信息和出版物并非旨在提供,也不构成TradingView提供或认可的任何形式的财务、投资、交易或其他类型的建议或推荐。请阅读使用条款了解更多信息。