Gold (XAU/USD) Technical Analysis – 30-Minute Chart
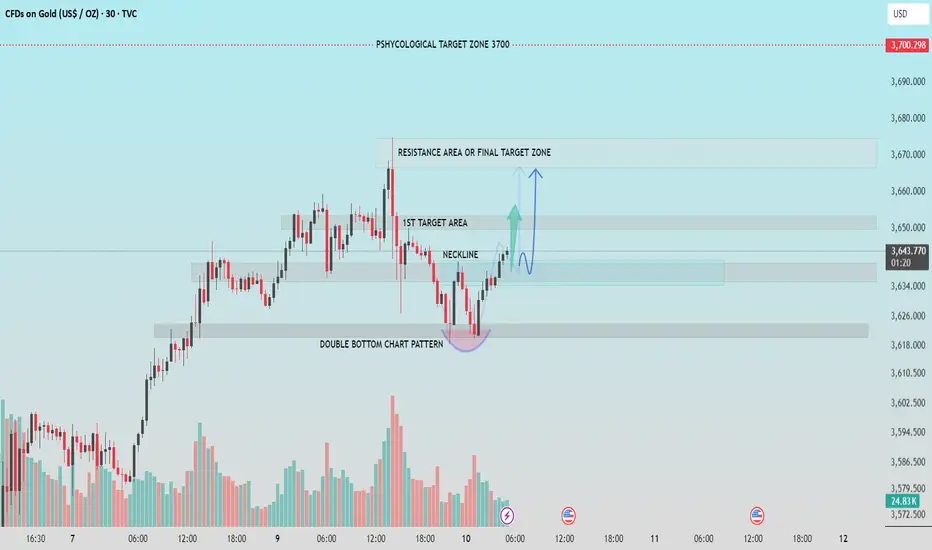
The chart shows a clear Double Bottom chart pattern near the $3,618–$3,620 support zone, indicating potential bullish reversal. This is a classic bullish pattern, often signaling the end of a downtrend and beginning of an upward move.
▪️Neckline Breakout
The neckline of the double bottom has been successfully broken around the $3,638 level, confirming the pattern. Price has retested the neckline and is now attempting to move higher.
▪️Key Target Zones
1st Target Area: $3,648–$3,652
Price is approaching the first resistance zone, which may act as short-term resistance.
Final Target / Resistance Zone: $3,668–$3,675
A breakout above the first target may drive price toward the final resistance zone.
▪️Psychological Target Zone: $3,700
This remains a significant psychological level and long-term bullish target if momentum continues.
▪️Volume Analysis
Volume increased notably during the formation and breakout of the double bottom, adding strength to the bullish reversal signal.
▪️Outlook
As long as price holds above the neckline support (~$3,638), the bullish scenario remains valid with potential targets of $3,652 and $3,675. Failure to hold above the neckline may invalidate the pattern.
If this helpful for you, press the like button.
交易开始
from 3640, after breakout & retest of double bottom .注释
1st target achieved,注释
注释
the one more layer was added from 3616, with sl 3610 & it's going 400 pips+ .交易结束:到达目标
💸FREE FOREX Signals in Telegram : t.me/FxInsightsHub0
🔹Join Our Telegram Channel, Pure Price Action Based Signals With Chart Analysis.
t.me/FxInsightsHub0
🚀FREE CRYPTO Signals In Telegram: t.me/FxInsightsHub0
🔹Join Our Telegram Channel, Pure Price Action Based Signals With Chart Analysis.
t.me/FxInsightsHub0
🚀FREE CRYPTO Signals In Telegram: t.me/FxInsightsHub0
相关出版物
免责声明
这些信息和出版物并不意味着也不构成TradingView提供或认可的金融、投资、交易或其它类型的建议或背书。请在使用条款阅读更多信息。