technical analysis chart for Gold (XAUUSD) on a 2-hour timeframe using TradingView. Let's break it down and analyze the key insights:
---
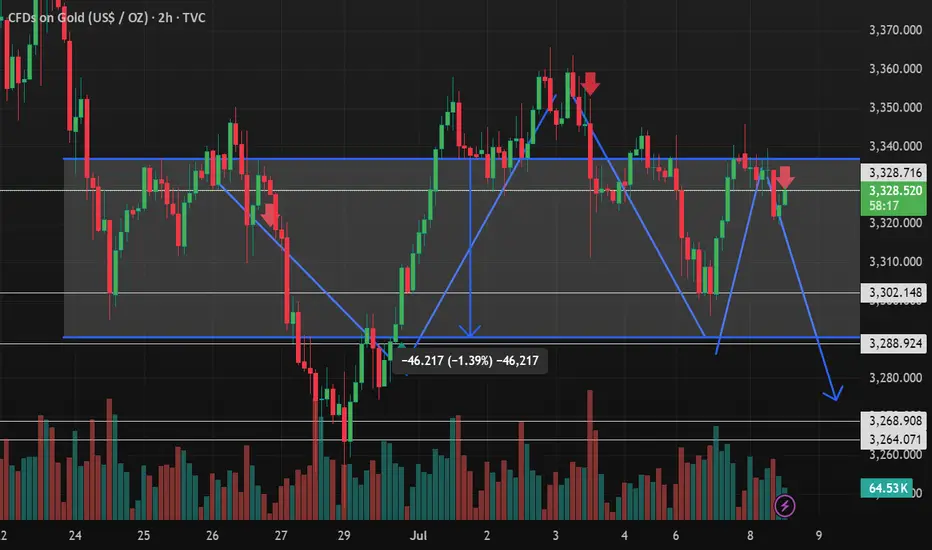
📉 Overall Trend
Currently bearish with lower highs and lower lows.
Price is struggling to break above the resistance around $3,340–$3,345.
---
🔍 Key Observations
1. Sell Zone (Red Arrow Marks):
Multiple sell signals shown with red arrows where price rejected the upper resistance levels.
Most recent rejection happened just above $3,328, where price failed to break higher.
2. Support Levels:
Strong support identified around $3,298, tested multiple times.
Next support zone appears near $3,280, shown with a projected downward arrow.
3. Pattern Formation:
A Head and Shoulders pattern may be forming — a bearish reversal signal.
Alternatively, this also looks like a range or a bearish flag in a continuation of the prior downtrend.
4. Volume Analysis:
Noticeable increase in bearish volume on recent candles, supporting the downward movement.
Bullish volume appears weaker in comparison.
---
🔮 Possible Scenario (Bearish Bias)
If the price fails to reclaim and close above $3,328–$3,330, a drop to $3,298 is likely.
If $3,298 breaks with strong volume, next target could be around $3,280 or even lower as marked by the blue arrows.
Measured move from the top to the neckline supports this downside projection.
---
📌 Key Levels to Watch
Type Level
Resistance $3,328 – $3,345
Support $3,298.26
Target $3,280 – $3,264
Entry Signal Below $3,298 with volume
---
✅ Strategy Suggestion
Short Bias: Wait for a breakdown below $3,298 with strong volume confirmation.
Invalidation: If price closes and holds above $3,345, bearish setup fails.
Risk Management: Place stop-loss above $3,345, target $3,280–$3,264.
---
Would you like help setting up a trading plan, or converting this analysis into a Pine Script strategy?
---
📉 Overall Trend
Currently bearish with lower highs and lower lows.
Price is struggling to break above the resistance around $3,340–$3,345.
---
🔍 Key Observations
1. Sell Zone (Red Arrow Marks):
Multiple sell signals shown with red arrows where price rejected the upper resistance levels.
Most recent rejection happened just above $3,328, where price failed to break higher.
2. Support Levels:
Strong support identified around $3,298, tested multiple times.
Next support zone appears near $3,280, shown with a projected downward arrow.
3. Pattern Formation:
A Head and Shoulders pattern may be forming — a bearish reversal signal.
Alternatively, this also looks like a range or a bearish flag in a continuation of the prior downtrend.
4. Volume Analysis:
Noticeable increase in bearish volume on recent candles, supporting the downward movement.
Bullish volume appears weaker in comparison.
---
🔮 Possible Scenario (Bearish Bias)
If the price fails to reclaim and close above $3,328–$3,330, a drop to $3,298 is likely.
If $3,298 breaks with strong volume, next target could be around $3,280 or even lower as marked by the blue arrows.
Measured move from the top to the neckline supports this downside projection.
---
📌 Key Levels to Watch
Type Level
Resistance $3,328 – $3,345
Support $3,298.26
Target $3,280 – $3,264
Entry Signal Below $3,298 with volume
---
✅ Strategy Suggestion
Short Bias: Wait for a breakdown below $3,298 with strong volume confirmation.
Invalidation: If price closes and holds above $3,345, bearish setup fails.
Risk Management: Place stop-loss above $3,345, target $3,280–$3,264.
---
Would you like help setting up a trading plan, or converting this analysis into a Pine Script strategy?
免责声明
这些信息和出版物并不意味着也不构成TradingView提供或认可的金融、投资、交易或其它类型的建议或背书。请在使用条款阅读更多信息。
免责声明
这些信息和出版物并不意味着也不构成TradingView提供或认可的金融、投资、交易或其它类型的建议或背书。请在使用条款阅读更多信息。