Gold Technical Analysis:
Daily Resistance: 4330, Support: 4131
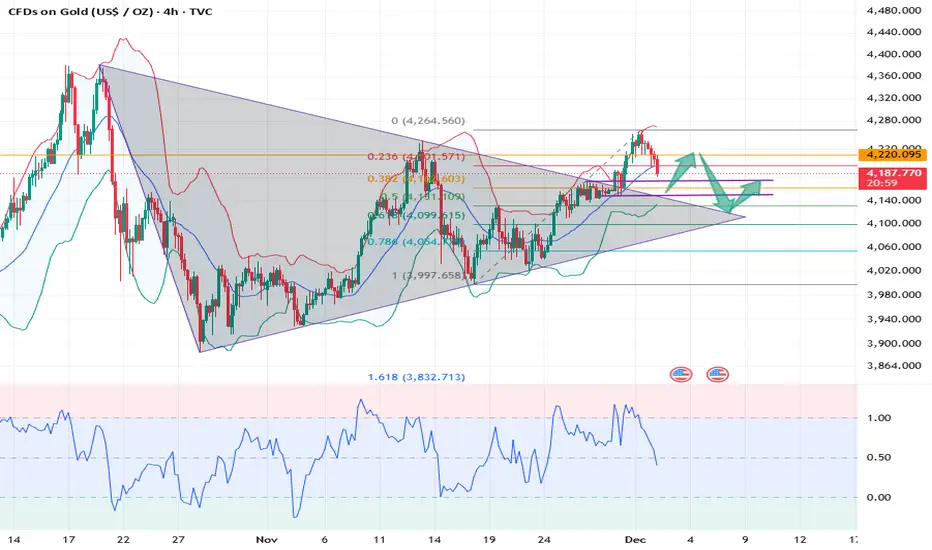
4-Hour Resistance: 4220, Support: 4150
1-Hour Resistance: 4210, Support: 4175
Yesterday, the gold market exhibited significant volatility. Gold prices surged, reaching a high of around 4264, demonstrating strong upward momentum. However, upon entering the New York session, the market sentiment shifted dramatically, and gold prices began to fluctuate and decline. The 4-hour chart shows that gold has successfully broken out of a clear symmetrical triangle pattern, a breakout signal indicating a continuation of the bullish trend. Although momentum has improved after the breakout, the RSI indicator remains in overbought territory around 65, making chasing the price higher risky in the short term. The short-term battleground between bulls and bears is around 4200.
Trading Strategy:
SELL: 4200near
SELL: 4210near
SELL: 4225near
More Analysis →
Daily Resistance: 4330, Support: 4131
4-Hour Resistance: 4220, Support: 4150
1-Hour Resistance: 4210, Support: 4175
Yesterday, the gold market exhibited significant volatility. Gold prices surged, reaching a high of around 4264, demonstrating strong upward momentum. However, upon entering the New York session, the market sentiment shifted dramatically, and gold prices began to fluctuate and decline. The 4-hour chart shows that gold has successfully broken out of a clear symmetrical triangle pattern, a breakout signal indicating a continuation of the bullish trend. Although momentum has improved after the breakout, the RSI indicator remains in overbought territory around 65, making chasing the price higher risky in the short term. The short-term battleground between bulls and bears is around 4200.
Trading Strategy:
SELL: 4200near
SELL: 4210near
SELL: 4225near
More Analysis →
💥Telegram Channel Free Updates 👉🏻
💥This a place for learning and communication. 👉🏻
💥Provide trading guidance.👉🏻
Telegram Channel👉🏻t.me/Actuary00group
💥This a place for learning and communication. 👉🏻
💥Provide trading guidance.👉🏻
Telegram Channel👉🏻t.me/Actuary00group
免责声明
这些信息和出版物并非旨在提供,也不构成TradingView提供或认可的任何形式的财务、投资、交易或其他类型的建议或推荐。请阅读使用条款了解更多信息。