Analysis
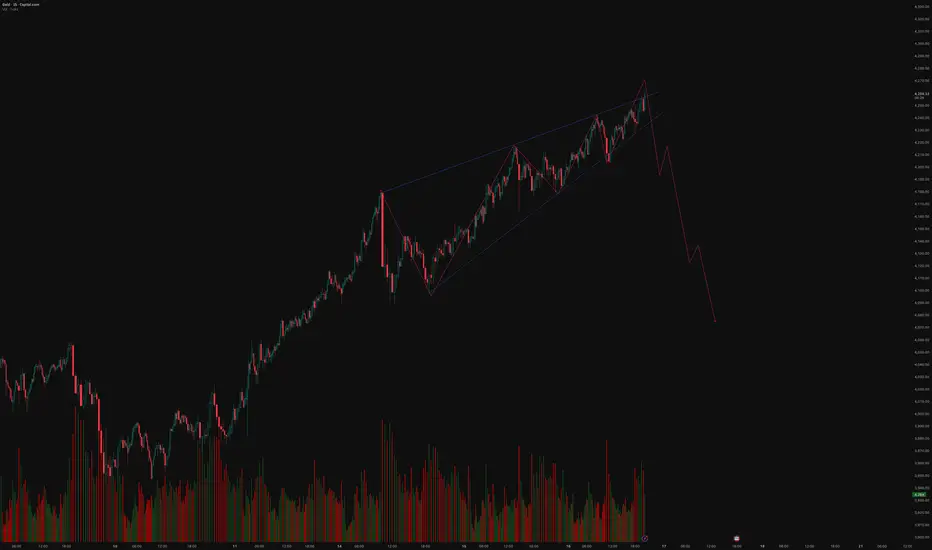
Pattern: A rising wedge has formed with converging trendlines — higher highs and higher lows narrowing into the apex.
Volume: Noticeable volume contraction during the formation, which often precedes a breakdown.
Current Position: Price appears to have made an upward breakout attempt, which may turn out to be a false breakout, a common precursor to a sharp downside move.
Projection: Once the lower trendline breaks decisively, a fast and impulsive decline toward lower support zones is probable — as shown by the projected path in red.
Summary
The structure suggests bearish momentum building up beneath the surface, with the recent false breakout likely to trap late buyers.
If confirmed with a close below the wedge support, this pattern could trigger a strong downside wave, potentially retracing the entire wedge formation.
Disclaimer
This analysis is for educational and technical discussion purposes only.
It does not constitute investment advice or a trading recommendation.
Please conduct your own research or consult a certified financial advisor before taking any trading positions.
交易开始
NOTE - TWO consecutive low makes gold weak
免责声明
这些信息和出版物并不意味着也不构成TradingView提供或认可的金融、投资、交易或其它类型的建议或背书。请在使用条款阅读更多信息。
免责声明
这些信息和出版物并不意味着也不构成TradingView提供或认可的金融、投资、交易或其它类型的建议或背书。请在使用条款阅读更多信息。