Gold/Silver Ratio – Watching Key Support on Quarterly Chart
Gold/Silver Ratio represents how many ounces of silver are needed to purchase one ounce of gold. It is a classic measure of relative value between the two precious metals.
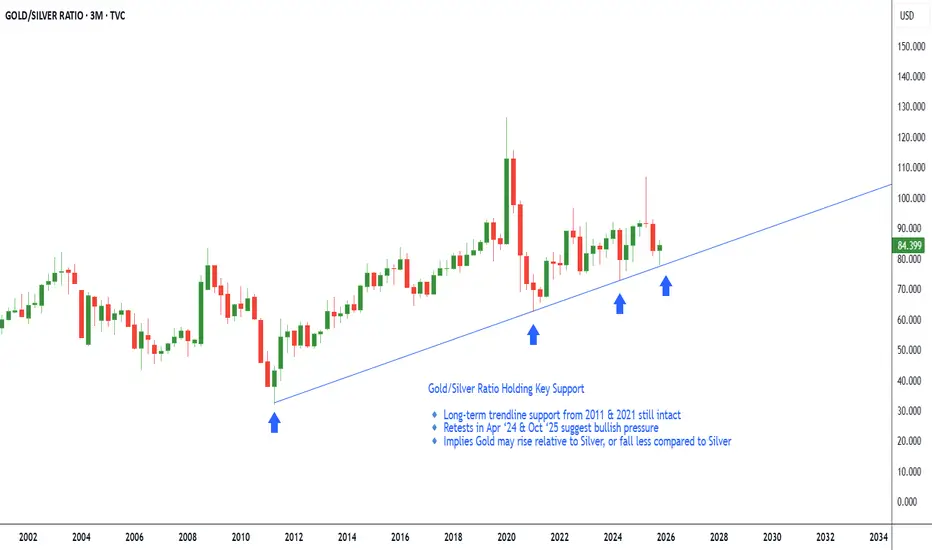
Generally, a rising ratio means gold is outperforming silver i.e. either rising faster or falling slower.
On the Quarterly chart, when we draw a trendline connecting the lows of April 2011 and January 2021, we see this trendline acting as strong support. The ratio took support in April 2024 and has again retested and held this trendline in October 2025.
This repeated bounce suggests the ratio is respecting this long-term support, which could imply a bullish bias in Gold vs Silver.
Implications:
Gold may outperform silver in coming months. This could be through gold rising faster, or falling less than silver in case of broader market weakness.
Refer Analysis of Silver chart
Gold/Silver Ratio represents how many ounces of silver are needed to purchase one ounce of gold. It is a classic measure of relative value between the two precious metals.
Generally, a rising ratio means gold is outperforming silver i.e. either rising faster or falling slower.
On the Quarterly chart, when we draw a trendline connecting the lows of April 2011 and January 2021, we see this trendline acting as strong support. The ratio took support in April 2024 and has again retested and held this trendline in October 2025.
This repeated bounce suggests the ratio is respecting this long-term support, which could imply a bullish bias in Gold vs Silver.
Implications:
Gold may outperform silver in coming months. This could be through gold rising faster, or falling less than silver in case of broader market weakness.
Refer Analysis of Silver chart
免责声明
这些信息和出版物并非旨在提供,也不构成TradingView提供或认可的任何形式的财务、投资、交易或其他类型的建议或推荐。请阅读使用条款了解更多信息。
免责声明
这些信息和出版物并非旨在提供,也不构成TradingView提供或认可的任何形式的财务、投资、交易或其他类型的建议或推荐。请阅读使用条款了解更多信息。