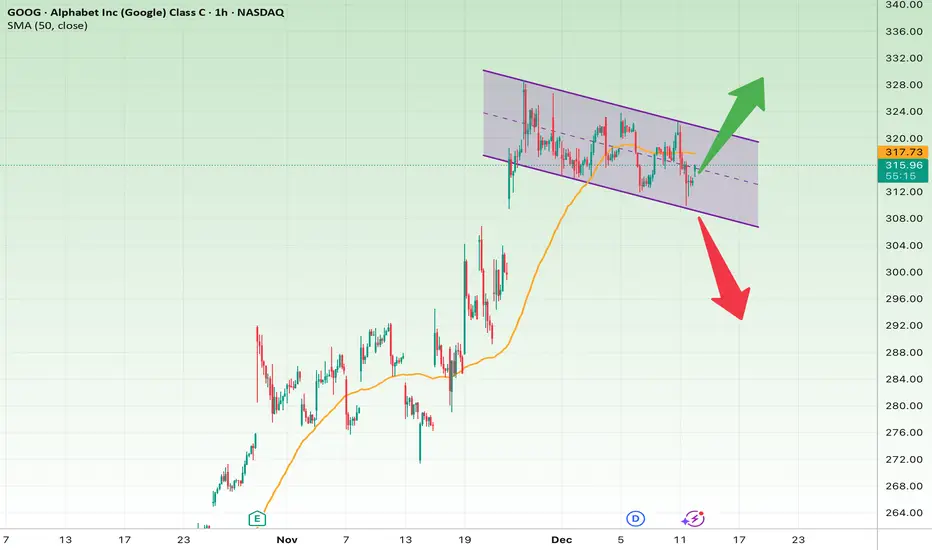
The price is currently oscillating inside a short-term descending channel. Multiple touches on both the upper and lower boundaries increase the pattern’s reliability. The SMA50 is positioned slightly above the price and is acting as resistance for now.
This structure suggests that the market is trapped between two scenarios and is likely to experience a breakout or breakdown soon.
Bullish Scenario
If the price breaks above the channel resistance (around 319–320) and closes a confirming candle above it:
Targets
• Target 1 → 323
• Target 2 → 327–328 (full channel breakout)
• Target 3 → 332
Stop-Loss
• A close below 313
Bullish Reasons
• EMA/SMA are beginning to flatten and may shift back upward
• Price action at the channel bottom signals active demand
• A bullish reversal pattern often forms after a short-term descending channel
Bearish Scenario
If the price breaks below the channel support at 310:
Targets
• Target 1 → 304–305
• Target 2 → 298–300
• Target 3 → 292
Stop-Loss
• A close back above 316–317
Bearish Reasons
• The MA50 is currently acting as resistance
• The descending channel has strong validity
• Multiple rejections at the channel top
Quick Summary
• GOOG is compressed inside a short-term descending channel.
• Break above 320 → continuation of the bullish move.
• Break below 310 → deeper correction likely.
• For now, the market is in a neutral to slightly bearish stance.
免责声明
这些信息和出版物并非旨在提供,也不构成TradingView提供或认可的任何形式的财务、投资、交易或其他类型的建议或推荐。请阅读使用条款了解更多信息。
免责声明
这些信息和出版物并非旨在提供,也不构成TradingView提供或认可的任何形式的财务、投资、交易或其他类型的建议或推荐。请阅读使用条款了解更多信息。