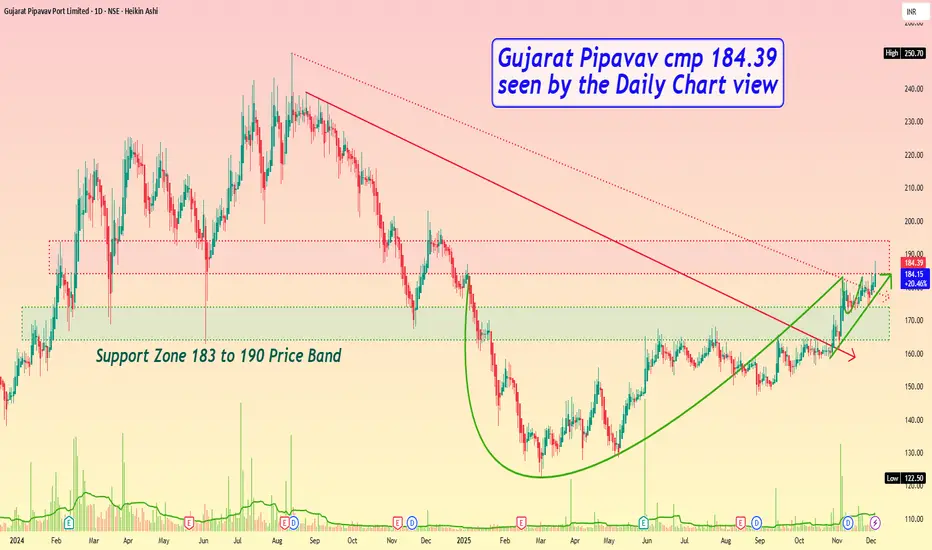
Gujarat Pipavav cmp 184.39 by Daily Chart view
- Support Zone 164 to 174 Price Band
- Resistance Zone 184 to 194 Price Band
- Bullish Cup & Handle formed by Resistance Zone neckline
- Breakout from both Falling Resistance Trendline well sustained
- Volumes spiking heavily to well above and in sync with avg traded qty
- Positively trending Technical Indicators BB, EMA, MACD, RSI, SAR, SuperTrend
免责声明
这些信息和出版物并非旨在提供,也不构成TradingView提供或认可的任何形式的财务、投资、交易或其他类型的建议或推荐。请阅读使用条款了解更多信息。
免责声明
这些信息和出版物并非旨在提供,也不构成TradingView提供或认可的任何形式的财务、投资、交易或其他类型的建议或推荐。请阅读使用条款了解更多信息。