做空
Gap Inc. Appearing to Reject 200 EMA Once Again
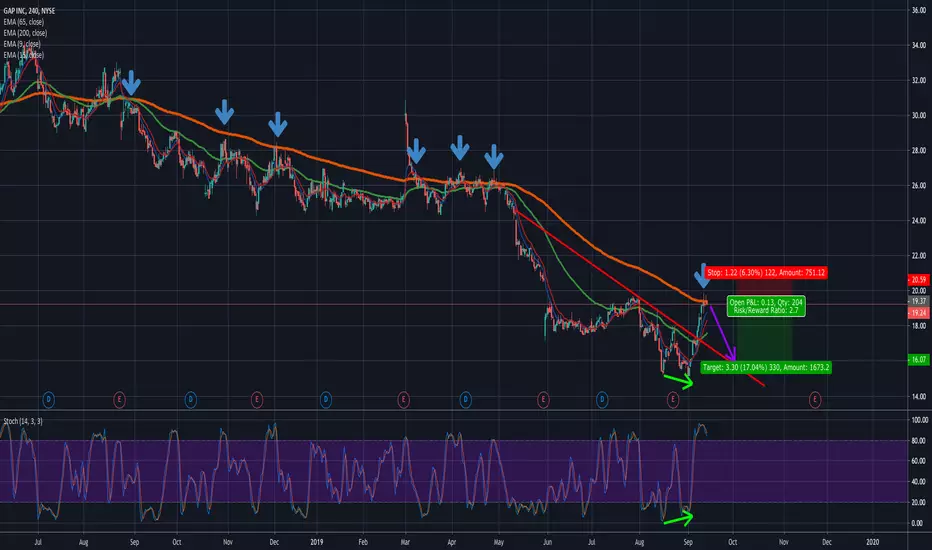
On the 4-hour chart of $NYSE:GPS, price action has interfered with the 200 Exponential Moving Average a numerous amount of times. And, almost every time it has, a reversal and price swing has occurred.
This latest one happened after a price surge caused by a normal stochastic oscillator divergence, sending price action straight through linear resistance. Old resistance becomes new support; the foundation of the technicals I've used to price target the short exit.
Gap Inc. is in a heavy sell off, as it has been for months on end. In some ways, this recent surge may be seen as standard price oscillation or even a short squeeze. The technicals right now are supporting a continuation of this collapsing trend.
Entry Price: $19.24.
Stop Loss: $20.55 (Resistance formed by movement before a downward gap)
Target Profit: $16.00
Methods of Capturing Gains
*Note: There is an infinite number of ways to capture bearishly favored gains. Be careful with the GPS weekly options because they have low volume, open interest, and liquidity, and can result in extremely unfavorable execution and fill pricing.
This latest one happened after a price surge caused by a normal stochastic oscillator divergence, sending price action straight through linear resistance. Old resistance becomes new support; the foundation of the technicals I've used to price target the short exit.
Gap Inc. is in a heavy sell off, as it has been for months on end. In some ways, this recent surge may be seen as standard price oscillation or even a short squeeze. The technicals right now are supporting a continuation of this collapsing trend.
Entry Price: $19.24.
Stop Loss: $20.55 (Resistance formed by movement before a downward gap)
Target Profit: $16.00
Methods of Capturing Gains
- Short stock.
- Short call credit spread.
- Naked puts.
- Put strike biased straddle.
- Bearish strangle.
*Note: There is an infinite number of ways to capture bearishly favored gains. Be careful with the GPS weekly options because they have low volume, open interest, and liquidity, and can result in extremely unfavorable execution and fill pricing.
交易手动结束
I closed the trade because there were some bull flags forming on lower timeframes, and because the M240 or H4 chart had just hit and rejected the Ichimoku red cloud. I don't want open positions while price action sits in the cloud, so I closed the trade for a hefty 10% equity profit and jackpots on the options.交易结束:到达目标
免责声明
这些信息和出版物并非旨在提供,也不构成TradingView提供或认可的任何形式的财务、投资、交易或其他类型的建议或推荐。请阅读使用条款了解更多信息。
免责声明
这些信息和出版物并非旨在提供,也不构成TradingView提供或认可的任何形式的财务、投资、交易或其他类型的建议或推荐。请阅读使用条款了解更多信息。