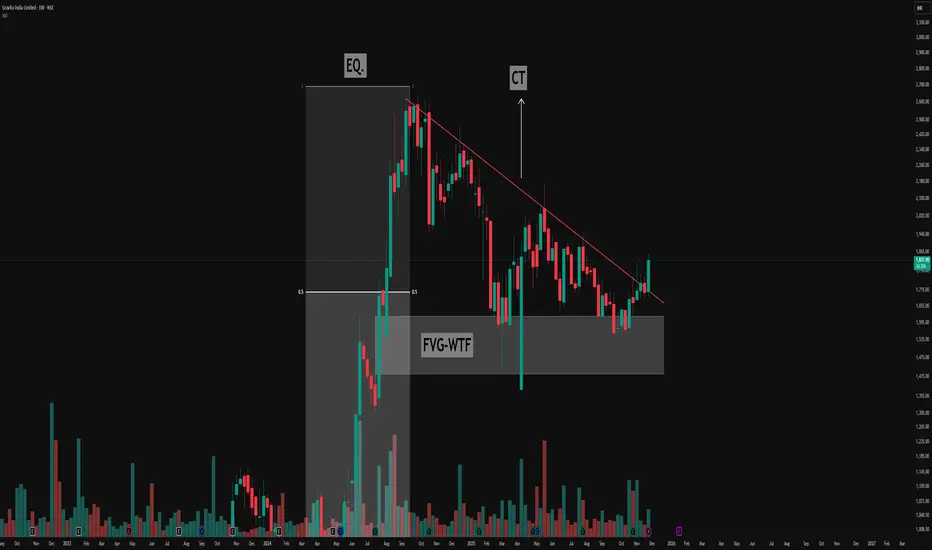
🔻Understanding the Pattern
- The chart above highlights a classic descending triangle pattern, easily visible by its series of lower highs (marked in red) and a relatively consistent demand zone acting as support.
- This resistance trendline (CT—Contraction Trendline) has been tested multiple times, confirming its significance as sellers consistently respond to price rallies by pushing back from lower levels.
🔻Equilibrium and Price Exploration
- Notice how price action moves from the equilibrium zone (EQ.)—the midpoint of the major move (from lows to all-time highs). This is a key area where supply and demand often rebalance
- The triangle structure forms as buyers continue to find value at support, while sellers become increasingly aggressive at lower highs, compressing price action over time.
🔻Weekly Fair Value Gap (FVG) in Focus
- A prominent Weekly Fair Value Gap (FVG-WTF) is identified, which price has tapped multiple times. This repeated interaction demonstrates its importance as a liquidity pocket where imbalances are re-tested and absorbed.
- Each revisit to this FVG offers a valuable lesson on how strong institutional levels serve as magnets, attracting price to resolve open liquidity.
This post is for educational purposes, highlighting how price structures can be interpreted without suggesting any forecast or trade.
🎯 Master My Self-Made Trading Strategy
📈 Telegram (Learn Today): t.me/hashtaghammer
✅ WhatsApp (Learn Today): wa.me/919455664601
📈 Telegram (Learn Today): t.me/hashtaghammer
✅ WhatsApp (Learn Today): wa.me/919455664601
相关出版物
免责声明
这些信息和出版物并非旨在提供,也不构成TradingView提供或认可的任何形式的财务、投资、交易或其他类型的建议或推荐。请阅读使用条款了解更多信息。