📊 Step 1: Price Action Analysis
Chart Summary:
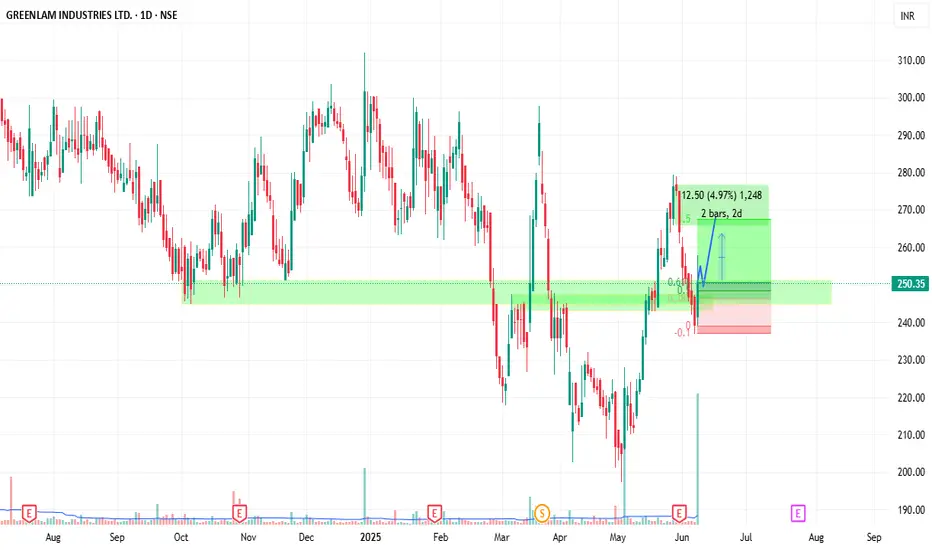
Price recently reversed from a low near ₹210 and surged toward ₹270.
A corrective pullback occurred, finding support near ₹240, which also aligns with a previous demand zone (highlighted green).
The stock is currently trading at ₹250.35 after a bounce off support, showing strength.
Candle Patterns:
Recent candles suggest bullish intent — long lower wicks and follow-through buying.
Small bullish structure forming with a potential higher low.
📈 Step 2: Volume and Momentum
Volume:
Noticeable volume spike during the uptrend in late May.
Volume during the recent pullback is lower, which is a bullish sign (healthy retracement).
Volatility:
Moderate range movement; not too aggressive — indicates stability and accumulation.
🔍 Step 3: Stage Identification
✅ Current Stage: Stage 2 – Early Accumulation to Markup
Why?
The stock completed a downtrend (Stage 4) from October 2024 to April 2025.
From May onward, it's shown clear higher highs and higher lows — a Stage 2 behavior.
Now consolidating and bouncing off a Fibonacci retracement level (0.618 zone).
Strong support established; retest done; buyers showing up.
🎯 Trade Structure (as per your chart):
Entry: Near ₹250–252
Stop-loss: Below ₹240
Target Zone: ₹262–270 (short-term), ₹280+ (medium-term)
🧠 Risk-Reward Ratio: Reasonable for swing entry
📈 Fibonacci Support: Bounce from 61.8% retracement confirms technical strength
✅ Final Strategy & Plan
Element Value
📌 Stage ✅ Stage 2 (Early markup)
📉 Support ₹240–244
📈 Resistance ₹270 (short), ₹280+ (next swing)
🎯 Target ₹262–270
❌ Stop-loss Below ₹240
🔔 Action Plan
Good for Swing Trade or Positional Entry
Add more on a breakout above ₹260 with volume
Trail SL above ₹244 once ₹260+ is sustained
Chart Summary:
Price recently reversed from a low near ₹210 and surged toward ₹270.
A corrective pullback occurred, finding support near ₹240, which also aligns with a previous demand zone (highlighted green).
The stock is currently trading at ₹250.35 after a bounce off support, showing strength.
Candle Patterns:
Recent candles suggest bullish intent — long lower wicks and follow-through buying.
Small bullish structure forming with a potential higher low.
📈 Step 2: Volume and Momentum
Volume:
Noticeable volume spike during the uptrend in late May.
Volume during the recent pullback is lower, which is a bullish sign (healthy retracement).
Volatility:
Moderate range movement; not too aggressive — indicates stability and accumulation.
🔍 Step 3: Stage Identification
✅ Current Stage: Stage 2 – Early Accumulation to Markup
Why?
The stock completed a downtrend (Stage 4) from October 2024 to April 2025.
From May onward, it's shown clear higher highs and higher lows — a Stage 2 behavior.
Now consolidating and bouncing off a Fibonacci retracement level (0.618 zone).
Strong support established; retest done; buyers showing up.
🎯 Trade Structure (as per your chart):
Entry: Near ₹250–252
Stop-loss: Below ₹240
Target Zone: ₹262–270 (short-term), ₹280+ (medium-term)
🧠 Risk-Reward Ratio: Reasonable for swing entry
📈 Fibonacci Support: Bounce from 61.8% retracement confirms technical strength
✅ Final Strategy & Plan
Element Value
📌 Stage ✅ Stage 2 (Early markup)
📉 Support ₹240–244
📈 Resistance ₹270 (short), ₹280+ (next swing)
🎯 Target ₹262–270
❌ Stop-loss Below ₹240
🔔 Action Plan
Good for Swing Trade or Positional Entry
Add more on a breakout above ₹260 with volume
Trail SL above ₹244 once ₹260+ is sustained
相关出版物
免责声明
这些信息和出版物并不意味着也不构成TradingView提供或认可的金融、投资、交易或其它类型的建议或背书。请在使用条款阅读更多信息。