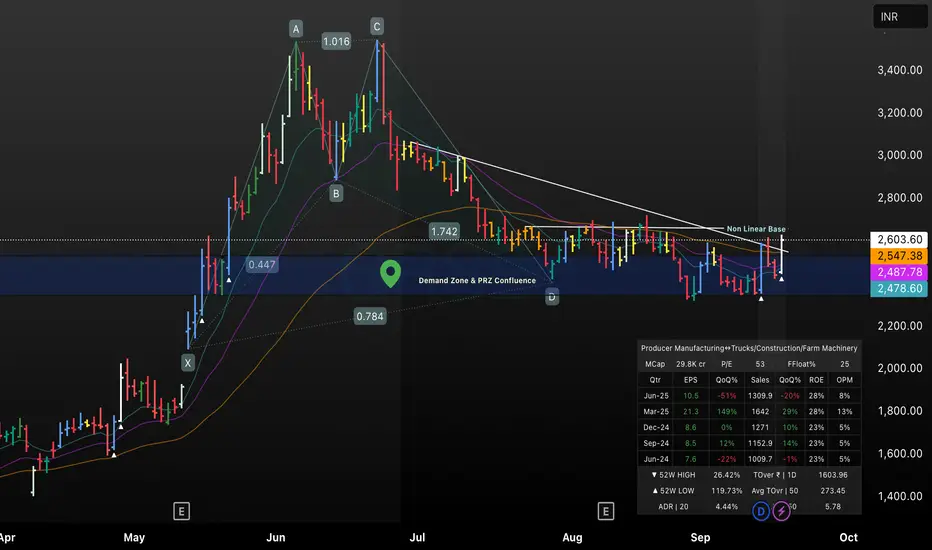
This TradingView chart presents the price action of GRSE, highlighting a demand zone and PRZ confluence area where the price reacted strongly before advancing to a Nonlinear Base resistance. The chart features a bullish breakout above key moving averages and trendlines, supported by volume and EPS growth data. Technical overlays include harmonic pattern completion, multi-timeframe support, and a clear visual of recent momentum shift, making this setup ideal for swing traders seeking confirmation in price-volume synergy and fundamental strength.
免责声明
这些信息和出版物并不意味着也不构成TradingView提供或认可的金融、投资、交易或其它类型的建议或背书。请在使用条款阅读更多信息。
免责声明
这些信息和出版物并不意味着也不构成TradingView提供或认可的金融、投资、交易或其它类型的建议或背书。请在使用条款阅读更多信息。