搜索
产品
社区
市场
经纪商
更多
CN
开始
Goldman Sachs Group, Inc. (The)
做多
已更新
9月23日
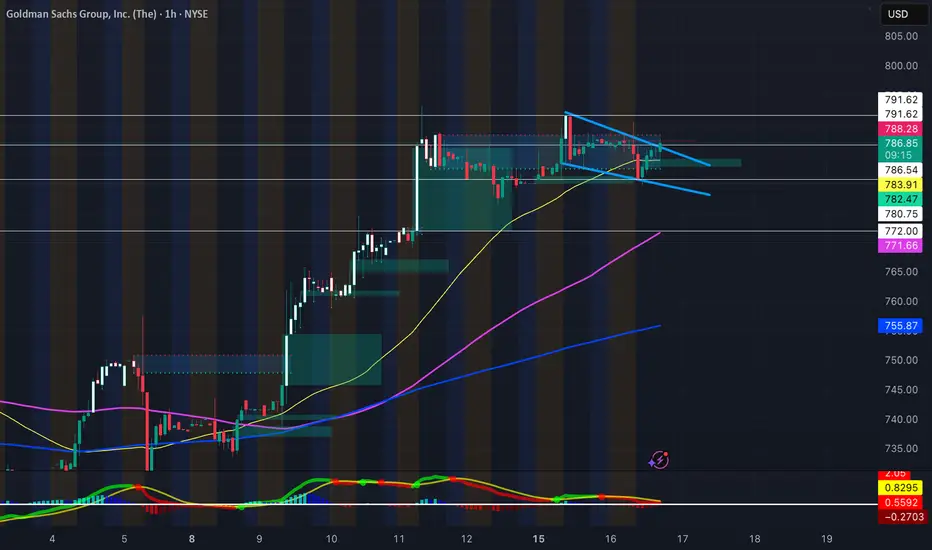
Long GS Falling Wedge Forming
3
获取这个图表
获取这个图表
3
3
168
9月16日
Falling wedge forming on
GS
hourly, with
GS
bouncing off its 50-day SMA. It's EMA's are curling upwards, and a bullish FVG formed as support. With pending FOMC conference tomorrow and potential rate cuts, certainly will be watching
GS
PT1 - 790.40
PT2 - 794.50
PT3 - 798.90
9月16日
交易开始
9月17日
注释
PT1 - Reached
9月23日
交易结束:到达目标
All Targets Reached, Trade Closed Circa ~148%
jacobosiason7
关注
更多:
Bullish Patterns
Chart Patterns
EMAS
falling_wedge
Falling Wedge
FOMC
fvg
Technical Indicators
LONG
rate_cut
rates
Trend Analysis
免责声明
这些信息和出版物并非旨在提供,也不构成TradingView提供或认可的任何形式的财务、投资、交易或其他类型的建议或推荐。请阅读
使用条款
了解更多信息。
Bullish Patterns
Chart Patterns
EMAS
falling_wedge
Falling Wedge
FOMC
fvg
Technical Indicators
LONG
rate_cut
rates
Trend Analysis
jacobosiason7
关注
更多:
免责声明
这些信息和出版物并非旨在提供,也不构成TradingView提供或认可的任何形式的财务、投资、交易或其他类型的建议或推荐。请阅读
使用条款
了解更多信息。