Current Price Action
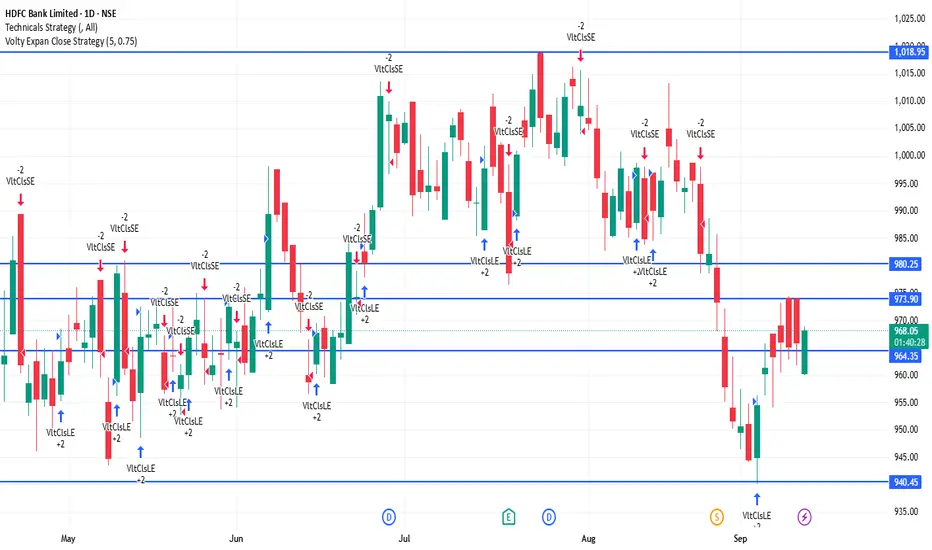
HDFCBANK is trading around ₹962–968.
Day’s low is near ₹960 and high is around ₹978.
The stock is consolidating in a tight range.
⚖️ Key Levels
Immediate Resistance: ₹968 – ₹970
Next Resistance: ₹975 – ₹980
Immediate Support: ₹960
Strong Support: ₹950 – ₹955
📊 Indicators
Moving Averages: Price is below the 50-day MA (short-term weakness) but above the 200-day MA (long-term trend still intact).
RSI (14-day): Around 40–45 → neutral to slightly weak momentum.
MACD: Negative bias, showing limited upside strength.
📈 Outlook
If HDFCBANK stays above ₹960, a bounce toward ₹970 – ₹975 is possible.
A breakout above ₹975 – ₹980 could turn the trend stronger.
If the stock slips below ₹955 – ₹950, it may head lower toward ₹940 – ₹935.
Current bias: Neutral to slightly bearish until price breaks above resistance.
相关出版物
免责声明
这些信息和出版物并不意味着也不构成TradingView提供或认可的金融、投资、交易或其它类型的建议或背书。请在使用条款阅读更多信息。