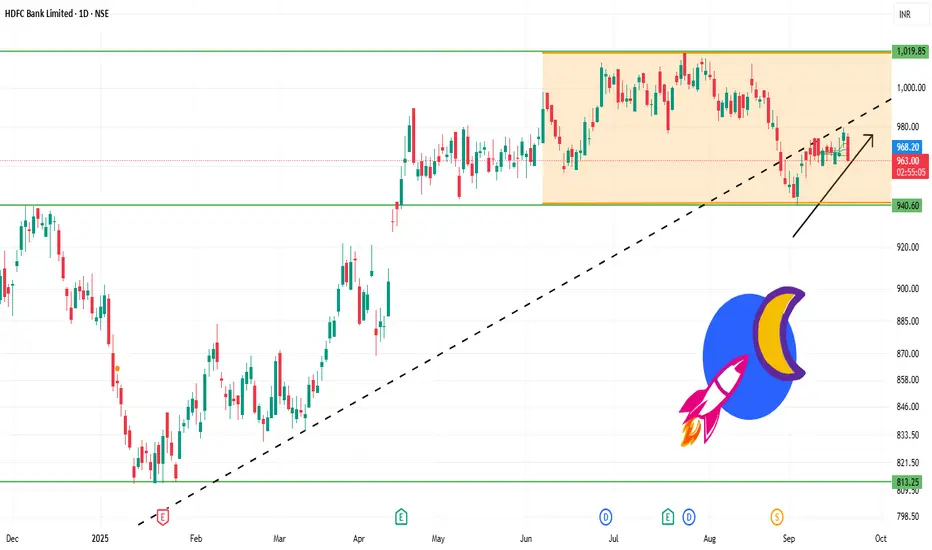
Trend
Trading around ₹967 – ₹970.
Stock is in a consolidation phase for the past few months.
Long-term trend is intact since it is above the 200-day moving average.
Support Levels
₹960 – ₹965 → immediate support zone.
₹945 – ₹950 → stronger support; if this breaks, stock may weaken further.
Resistance Levels
₹970 – ₹975 → immediate resistance; stock is struggling to cross this area.
₹980 – ₹992 → next major resistance; breakout above this could open path to ₹1,020.
Indicators
RSI near 55 → neutral to mildly bullish, not overbought.
MACD positive, showing some upward momentum.
Short-term moving averages are mixed, but long-term support remains strong.
Price Action
Range-bound between ₹960 – ₹975.
Breakout or breakdown from this range will decide the next trend.
✅ Facts & Insights
Fact 1: Above ₹975, HDFC Bank can rally towards ₹980 – ₹992 and possibly ₹1,020.
Fact 2: Below ₹960, stock may slip to ₹945 – ₹950, and deeper to ₹920 – ₹900 if weakness continues.
Fact 3: Long-term outlook remains positive, but short-term is sideways until a breakout.
相关出版物
免责声明
这些信息和出版物并不意味着也不构成TradingView提供或认可的金融、投资、交易或其它类型的建议或背书。请在使用条款阅读更多信息。