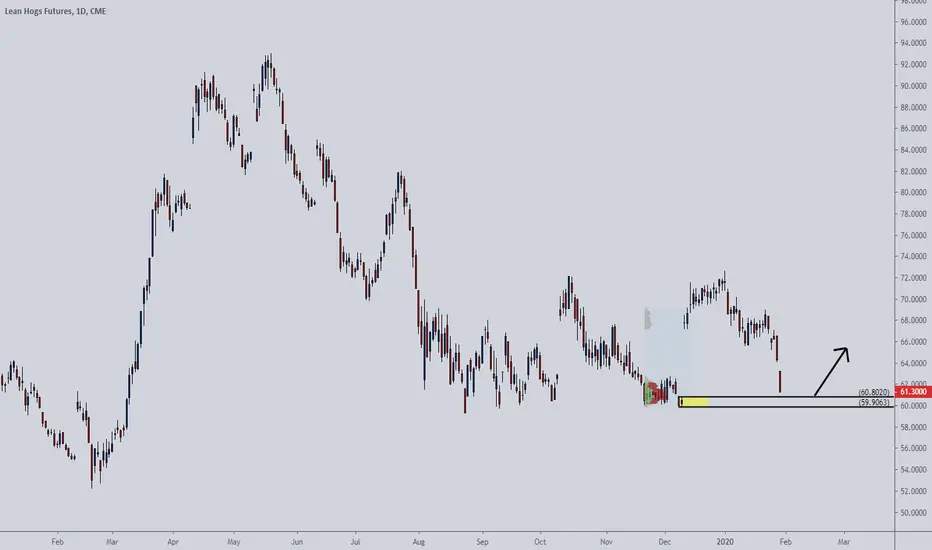
A long red candle has formed on the daily chart. A strong gap down, however, I identified a volume cluster just below the current price. If buyers are strong, they will push the price up again. A strong demand zone is also just below the current price.
Our target is 1 to 1, and the stop is a close, on the daily chart, below the lower line.
Our target is 1 to 1, and the stop is a close, on the daily chart, below the lower line.
免责声明
这些信息和出版物并非旨在提供,也不构成TradingView提供或认可的任何形式的财务、投资、交易或其他类型的建议或推荐。请阅读使用条款了解更多信息。
免责声明
这些信息和出版物并非旨在提供,也不构成TradingView提供或认可的任何形式的财务、投资、交易或其他类型的建议或推荐。请阅读使用条款了解更多信息。