🔎 Chart Structure
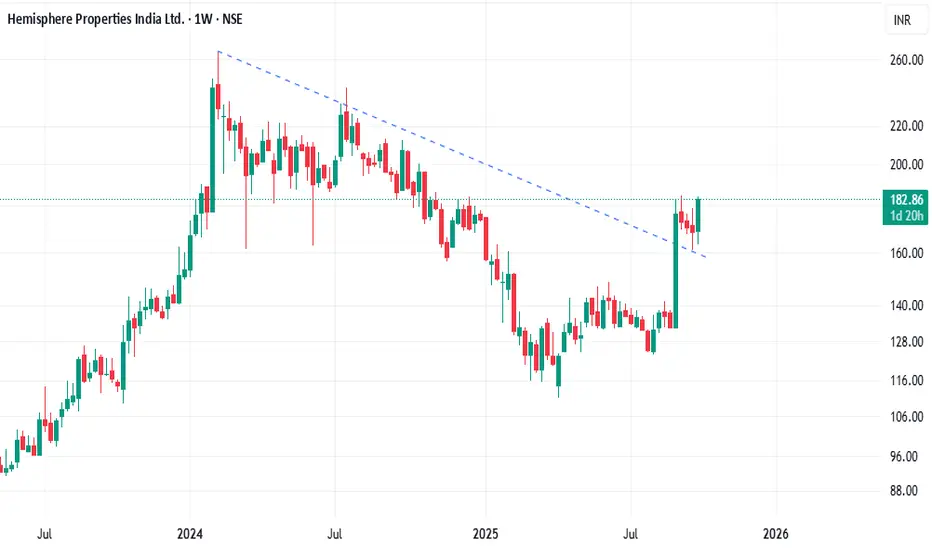
The stock was in a prolonged downtrend since early 2024, capped by a falling trendline.
Recently, it gave a trendline breakout above the ₹175–₹180 zone.
Importantly, the breakout has been retested successfully – price dipped towards the trendline support, held firmly, and bounced back.
This retest adds strength and reliability to the breakout, suggesting a shift in trend from bearish to bullish.
📈 Trend & Indicators
Sustaining above ₹180 confirms bullish control.
Next resistance levels: ₹200–₹205 zone (swing high) and ₹225 (medium-term).
Supports: Immediate at ₹165, stronger support near ₹145.
Weekly momentum is turning positive, confirming renewed buying interest.
⚠️ Risk Factors
If the stock falls back below ₹165, the breakout may fail, leading to consolidation.
Sectoral news and overall market conditions will heavily influence momentum.
🎯 View
Bias: Bullish (Post Breakout & Retest Confirmation)
Targets: ₹200 (short-term), ₹225 (medium-term).
Stop Loss (Positional): ₹160 (weekly closing).
📌 Disclaimer
This analysis is for educational and informational purposes only. It is based on technical observations and does not constitute investment advice. Investors should consult a SEBI-registered financial advisor before making investment decisions.
免责声明
这些信息和出版物并非旨在提供,也不构成TradingView提供或认可的任何形式的财务、投资、交易或其他类型的建议或推荐。请阅读使用条款了解更多信息。
免责声明
这些信息和出版物并非旨在提供,也不构成TradingView提供或认可的任何形式的财务、投资、交易或其他类型的建议或推荐。请阅读使用条款了解更多信息。