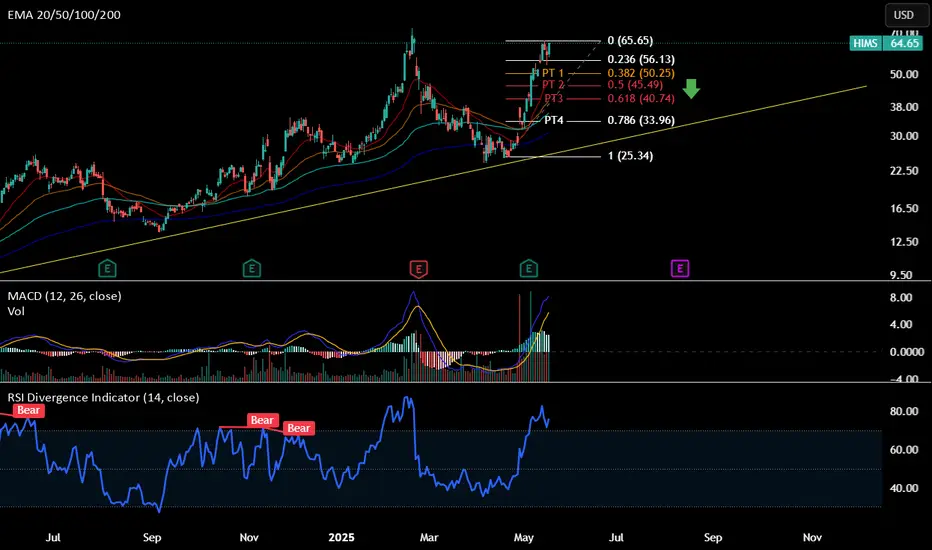
Long-term trend line: Rising trend line -> short-term bearish due to expected trend line retest (yellow trend line)
Daily MACD & RSI : Overbought -> expect a pull back
Support Line to enter PUT: ~$54
Expected time zone for pullback: 30 days to 50 days
PT1: ~50.25
PT2: ~45.49
PT3: ~40.74
PT4: ~34.96
Possible PT5: expect to cross down the EMA 200 at ~$27, which is close to the trendline support. However, I'll exit all play at PT4.
交易开始
Support line breaks -> PUT active注释
Take profits from one time hits $54 and today at 52.5$54 is a very stubborn support
注释
PUT option if $51 breaksStop loss: ~54
HIMS seems like it wants to retest the ATH ~72.9 as it has been accumulating for days in range 51.8 -56
交易结束:到达目标
注释
HIMS rejected hard at the resistance at $67-> this PUT play to reach PT 2 might be active again if it breaks support at $51.3免责声明
The information and publications are not meant to be, and do not constitute, financial, investment, trading, or other types of advice or recommendations supplied or endorsed by TradingView. Read more in the Terms of Use.
免责声明
The information and publications are not meant to be, and do not constitute, financial, investment, trading, or other types of advice or recommendations supplied or endorsed by TradingView. Read more in the Terms of Use.