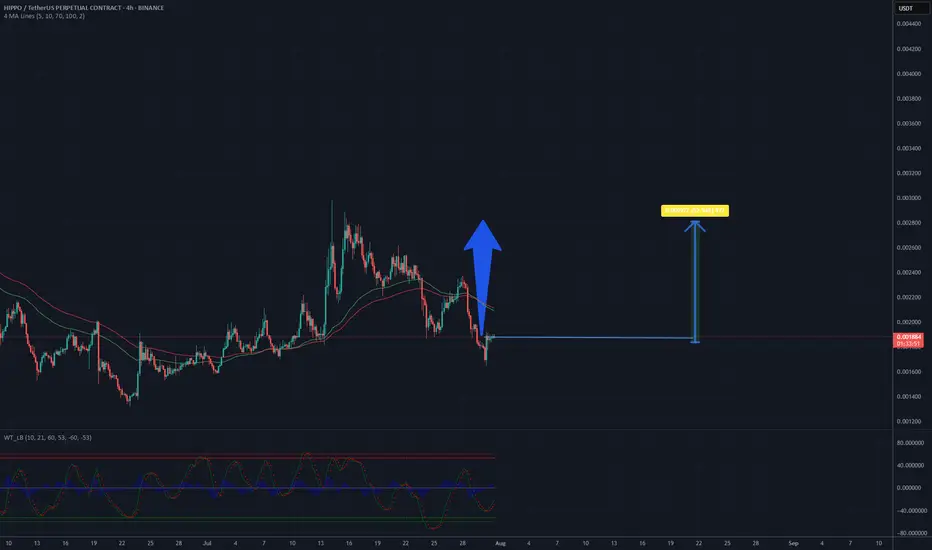
The chart displays a 4-hour candlestick pattern for the HIPPO/USDT perpetual contract on Binance, showing price movements from late June to mid-September 2025. The price has recently experienced a downward trend after reaching a peak, with a noticeable drop from around 0.0028 to the current level of approximately 0.00186. The moving averages (red and green lines) indicate a potential bearish crossover, suggesting continued downward pressure in the short term. However, the price is approaching a support level near 0.0017, where historical buying interest might emerge. The oscillator at the bottom shows mixed signals, with a slight uptick that could hint at a potential reversal if momentum builds. Based on this analysis, a price recovery to 0.0028 seems plausible if the support holds and buying volume increases in the coming sessions.
Potential TP: 0.0028 USD
Potential TP: 0.0028 USD
免责声明
这些信息和出版物并非旨在提供,也不构成TradingView提供或认可的任何形式的财务、投资、交易或其他类型的建议或推荐。请阅读使用条款了解更多信息。
免责声明
这些信息和出版物并非旨在提供,也不构成TradingView提供或认可的任何形式的财务、投资、交易或其他类型的建议或推荐。请阅读使用条款了解更多信息。