📊 1-Week Technical Overview
Price Change: HSCL has gained approximately 3.35% over the past week.
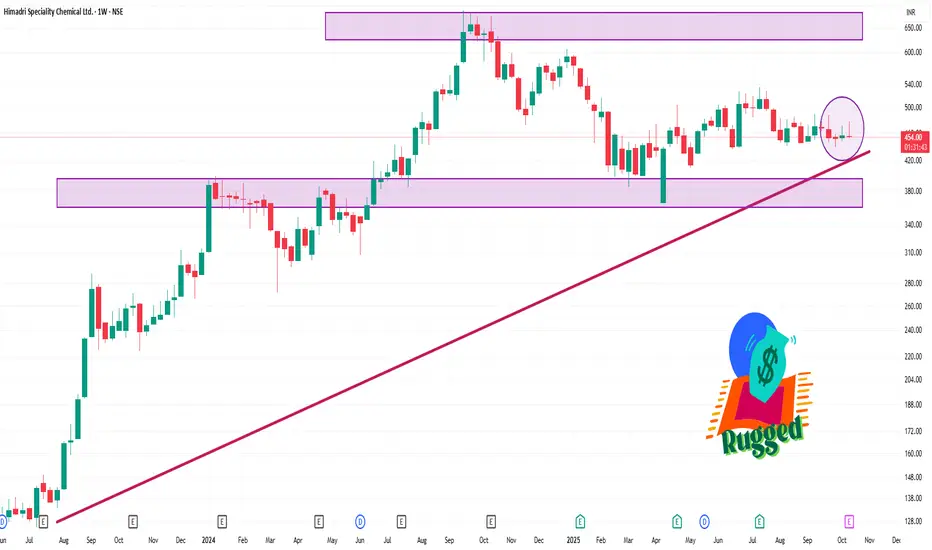
Day Range: ₹458.60 – ₹469.55
52-Week Range: ₹365.35 – ₹676.20
Volume: 535,912 shares traded
📈 Technical Indicators
Relative Strength Index (RSI): 36.75, suggesting a neutral to slightly oversold condition.
Moving Averages: Short-term (5-day) and medium-term (50-day) moving averages indicate a neutral to slightly bearish outlook.
MACD: The Moving Average Convergence Divergence indicator is negative, reinforcing a bearish sentiment.
Price Change: HSCL has gained approximately 3.35% over the past week.
Day Range: ₹458.60 – ₹469.55
52-Week Range: ₹365.35 – ₹676.20
Volume: 535,912 shares traded
📈 Technical Indicators
Relative Strength Index (RSI): 36.75, suggesting a neutral to slightly oversold condition.
Moving Averages: Short-term (5-day) and medium-term (50-day) moving averages indicate a neutral to slightly bearish outlook.
MACD: The Moving Average Convergence Divergence indicator is negative, reinforcing a bearish sentiment.
相关出版物
免责声明
这些信息和出版物并非旨在提供,也不构成TradingView提供或认可的任何形式的财务、投资、交易或其他类型的建议或推荐。请阅读使用条款了解更多信息。