Hello Traders,
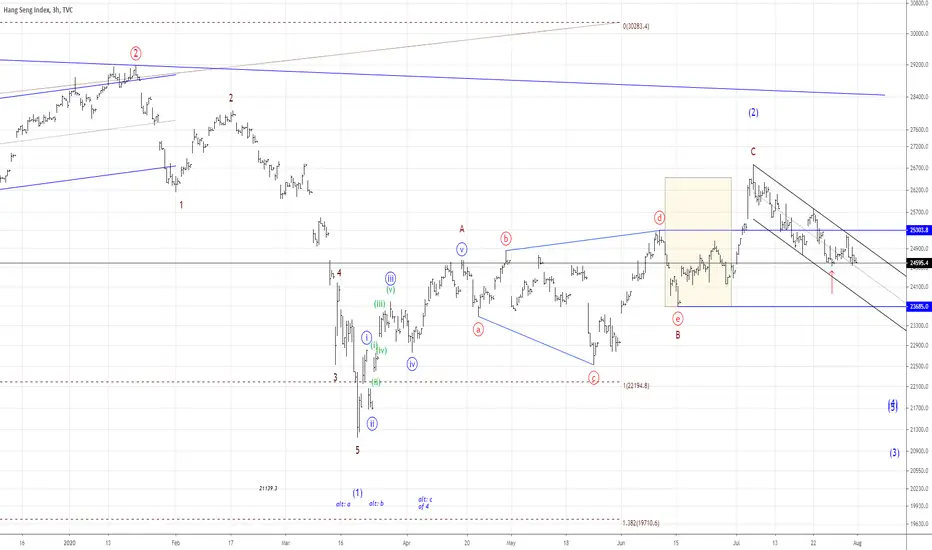
Hang Seng and the Hang Seng short index hasn't made net progress in the latter week. This should imply a pause in a downtrend. If so, Hang Seng is on the verge to break to the wave ((e)) of „B“ low @ 23685, which was the low of the triangle pattern. The more bearish potential exists!
A break of the 24526 area (denoted with the red arrow) implies further weakness for HS and opens the door to the mentioned area before.
I have drawn a trend channel o show how HS is moving lower. One possibility is, that HS will decline in one more down-up-down sequence to complete the first waves of wave ((1)) and a pullback in a wave ((2)) and retrace a 0.5 – 0.618 Fibonacci of the decline. But there is still much time to go for this scenario.
A move above the high @ 26284 – 26347 would lower the count a minimum.
Have a great Sunday...
ruebennase
Feel free to ask or comment!
Trading this analysis is at your own risk!
免责声明
这些信息和出版物并不意味着也不构成TradingView提供或认可的金融、投资、交易或其它类型的建议或背书。请在使用条款阅读更多信息。
免责声明
这些信息和出版物并不意味着也不构成TradingView提供或认可的金融、投资、交易或其它类型的建议或背书。请在使用条款阅读更多信息。