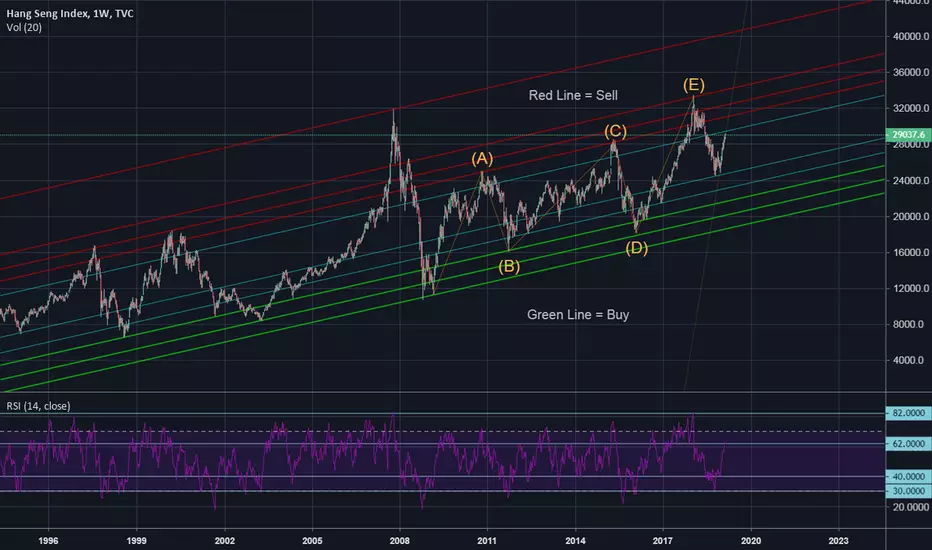
SELL When:
- RSI reaches 82
- Touches the RED Line with RSI reaches 70
- Bearish RSI Divergence occurs
BUY When:
- Touches the GREEN Line with RSI reaches 30
- Bullish RSI Divergence occurs
- RSI reaches 82
- Touches the RED Line with RSI reaches 70
- Bearish RSI Divergence occurs
BUY When:
- Touches the GREEN Line with RSI reaches 30
- Bullish RSI Divergence occurs
免责声明
这些信息和出版物并不意味着也不构成TradingView提供或认可的金融、投资、交易或其它类型的建议或背书。请在使用条款阅读更多信息。