In my eyes the move to the upside is hard to analyze.
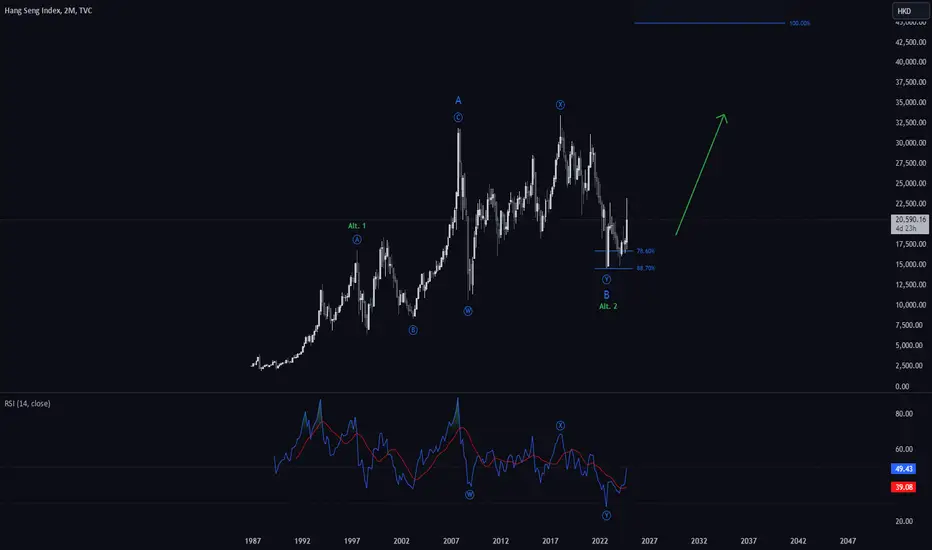
But im pretty sure the Index established its bottom in Sep 22.
The (w-x-y) stopped perfectly on the 0.887 Fib-Ext.
RSI signals clear bottom and the MACD also showing trend reversal on the 2M.

But im pretty sure the Index established its bottom in Sep 22.
The (w-x-y) stopped perfectly on the 0.887 Fib-Ext.
RSI signals clear bottom and the MACD also showing trend reversal on the 2M.
免责声明
这些信息和出版物并不意味着也不构成TradingView提供或认可的金融、投资、交易或其它类型的建议或背书。请在使用条款阅读更多信息。
免责声明
这些信息和出版物并不意味着也不构成TradingView提供或认可的金融、投资、交易或其它类型的建议或背书。请在使用条款阅读更多信息。