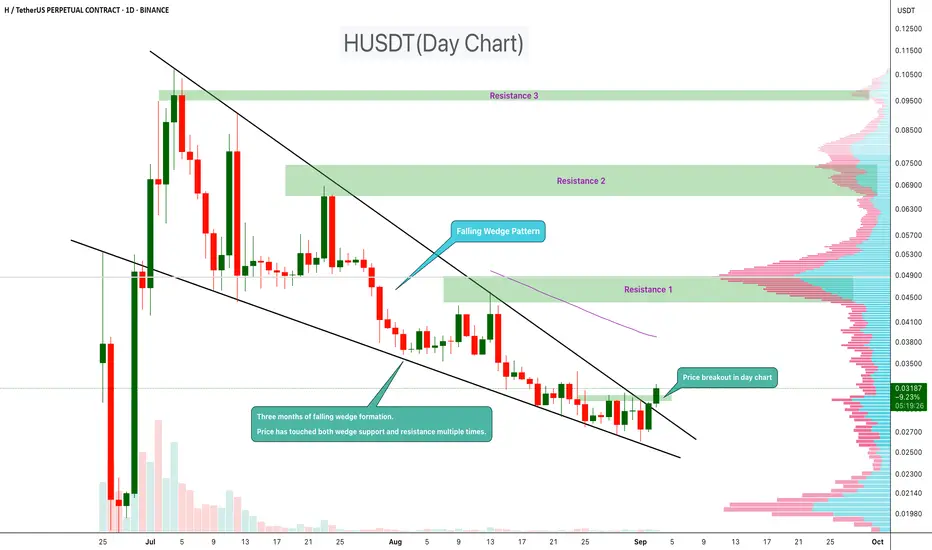
HUSDT has been forming a falling wedge pattern over the past three months. During this period, the price has tested both the wedge support and resistance multiple times, confirming the structure.
Now, a breakout has appeared on the daily chart, suggesting that bullish momentum may be building. Falling wedges are typically seen as reversal patterns, often leading to upside continuation once the breakout is confirmed.
Resistance 1:$0.045
Resistance 2:$0.066
Resistance 2:$0.095
cheers
Hexa
Now, a breakout has appeared on the daily chart, suggesting that bullish momentum may be building. Falling wedges are typically seen as reversal patterns, often leading to upside continuation once the breakout is confirmed.
Resistance 1:$0.045
Resistance 2:$0.066
Resistance 2:$0.095
cheers
Hexa
交易开始
50%+ profit
🚀Telegram : t.me/hexatrades
🌐Website: hexatrades.io/
🗣️Twitter(X): twitter.com/HexaTrades
🌐Website: hexatrades.io/
🗣️Twitter(X): twitter.com/HexaTrades
相关出版物
免责声明
这些信息和出版物并不意味着也不构成TradingView提供或认可的金融、投资、交易或其它类型的建议或背书。请在使用条款阅读更多信息。
🚀Telegram : t.me/hexatrades
🌐Website: hexatrades.io/
🗣️Twitter(X): twitter.com/HexaTrades
🌐Website: hexatrades.io/
🗣️Twitter(X): twitter.com/HexaTrades
相关出版物
免责声明
这些信息和出版物并不意味着也不构成TradingView提供或认可的金融、投资、交易或其它类型的建议或背书。请在使用条款阅读更多信息。