📊 Daily Snapshot
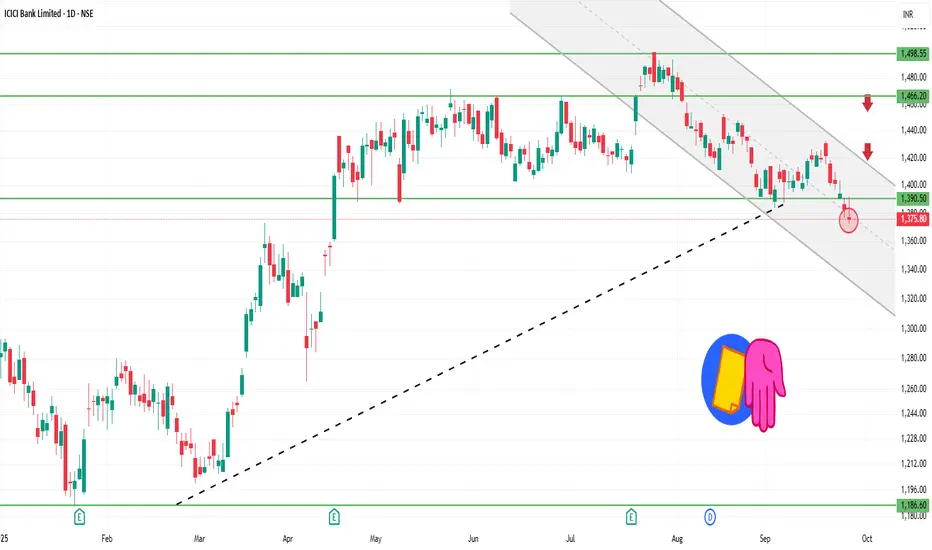
Closing Price: ₹1,375.50
Day’s Range: ₹1,371.80 – ₹1,391.50
Previous Close: ₹1,382.70
Change: Down –0.52%
52-Week Range: ₹1,018.85 – ₹1,494.10
Market Cap: ₹9.7 lakh crore
P/E Ratio: 20.5
Dividend Yield: 1.2%
EPS (TTM): ₹67.00
Beta: 1.05 (moderate volatility)
🔑 Key Technical Levels
Support Zone: ₹1,370 – ₹1,375
Resistance Zone: ₹1,390 – ₹1,400
All-Time High: ₹1,494.10
📈 Technical Indicators
RSI (14-day): 34.1 – approaching oversold territory, suggesting potential for a rebound.
MACD: Negative, indicating bearish momentum.
Moving Averages: Trading below the 150-day moving average, indicating a bearish trend.
Candlestick Patterns: Recent formation of a Bearish Engulfing pattern, suggesting potential for further downside.
📉 Market Sentiment
Recent Performance: ICICI Bank has experienced a decline for the fifth consecutive session, underperforming the broader market.
Sector Performance: The NIFTY BANK index also closed lower, reflecting sector-wide weakness.
📈 Strategy (1D Timeframe)
1. Bullish Scenario
Entry: Above ₹1,390
Stop-Loss: ₹1,370
Target: ₹1,405 → ₹1,420
2. Bearish Scenario
Entry: Below ₹1,370
Stop-Loss: ₹1,390
Target: ₹1,355 → ₹1,340
相关出版物
免责声明
这些信息和出版物并不意味着也不构成TradingView提供或认可的金融、投资、交易或其它类型的建议或背书。请在使用条款阅读更多信息。