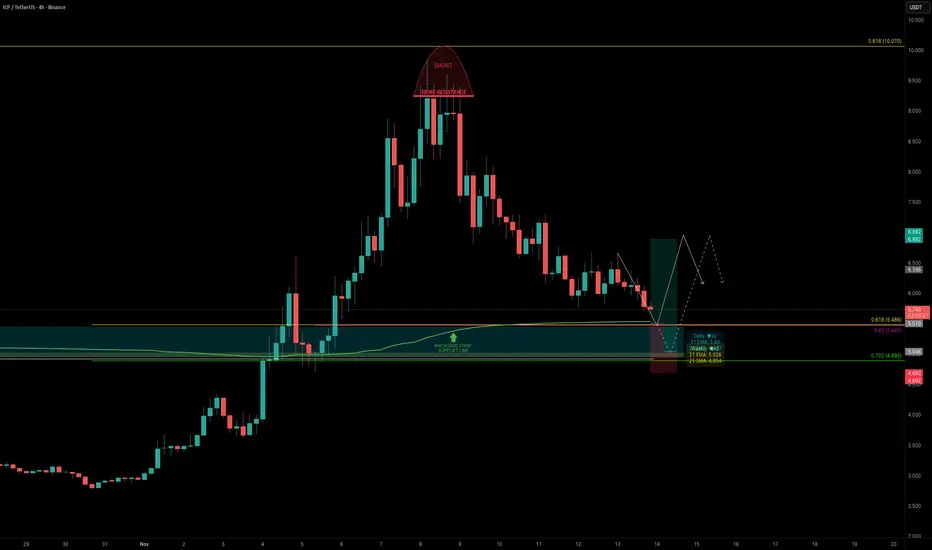
ICP had a great start to November, rallying over +250% in just 8 days before topping out just below the 0.618 Fibonacci retracement (~$10), right at the $3B MC resistance.
Over the past 5 days, ICP has retraced -42% from the high. The key question now: where is the next high-probability long opportunity?
Key Confluences around the $5.5 Zone
One level that stands out strongly is the $5.5 zone, where several major supports align:
🟢 Trade Setup Plan
Targets:
🔍 Indicators used
➡️ Available for free. You can find it on my profile under “Scripts” and apply it directly to your charts for extra confluence when planning your trades.
_________________________________
💬 If you found this helpful, drop a like and comment!
Over the past 5 days, ICP has retraced -42% from the high. The key question now: where is the next high-probability long opportunity?
Key Confluences around the $5.5 Zone
One level that stands out strongly is the $5.5 zone, where several major supports align:
- 0.618 Fib retracement of the entire +250% rally
- 0.85 Fib retracement of the smaller internal wave aligns right with the major 0.618 level
- Anchored VWAP (280 day) clustering right around $5.5, adding volume-weighted support
- Quarterly VWAP currently sits near $5.62
- Daily 21 EMA at $5.45
- Weekly 21 EMA/SMA both at around $5
- $5.5 = $3B market cap
- Point of Control (POC) of the past ~280 days sits around $4.9, marking it as the final major support layer below
🟢 Trade Setup Plan
- Entry Zone: $5.6 – $5.0
- Stop-Loss: Below POC
Targets:
- TP1: $6.0
- TP2: $6.9 (VWAP resistance / 0.382 Fib)
- TP3: 0.618 FR
- Risk/Reward: 1:2+, depending on entry precision
🔍 Indicators used
- Multi Timeframe 8x MA Support Resistance Zones [SiDec] → to identify support and resistance zones such as the daily/weekly 21 EMA/SMA.
➡️ Available for free. You can find it on my profile under “Scripts” and apply it directly to your charts for extra confluence when planning your trades.
_________________________________
💬 If you found this helpful, drop a like and comment!
注释
VWAP indicator in development:🏆 Mastering Fibonacci for precision trading
🔹 Sharing high-probability trade setups
⚡ Unlock the power of technical analysis!
🔹 Sharing high-probability trade setups
⚡ Unlock the power of technical analysis!
相关出版物
免责声明
The information and publications are not meant to be, and do not constitute, financial, investment, trading, or other types of advice or recommendations supplied or endorsed by TradingView. Read more in the Terms of Use.
🏆 Mastering Fibonacci for precision trading
🔹 Sharing high-probability trade setups
⚡ Unlock the power of technical analysis!
🔹 Sharing high-probability trade setups
⚡ Unlock the power of technical analysis!
相关出版物
免责声明
The information and publications are not meant to be, and do not constitute, financial, investment, trading, or other types of advice or recommendations supplied or endorsed by TradingView. Read more in the Terms of Use.