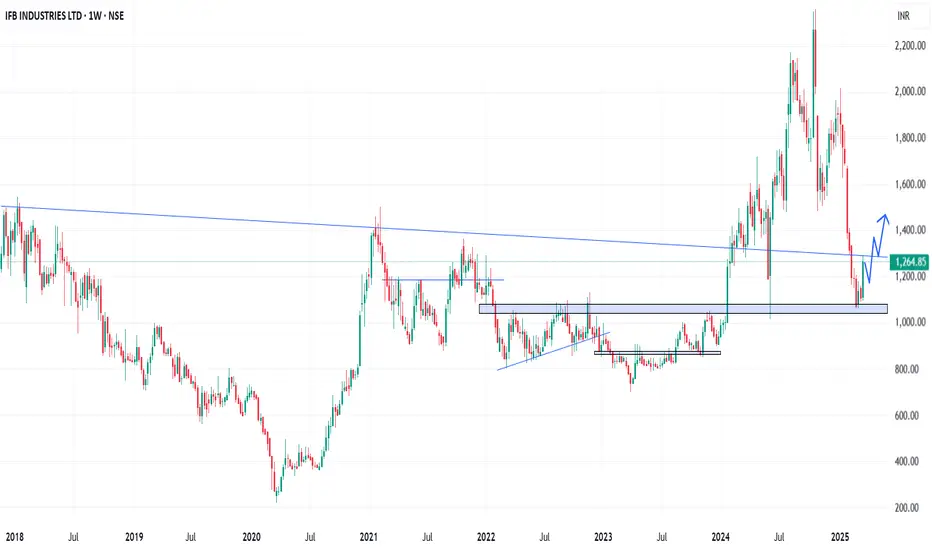
In the Weekly Chart of IFBIND ,
we can see that; it has given a bounce back from Support of 1080-1100 Trendline.
wait for a Halt or retrace candle and then enter with SL and Targets.
Expected momentum is shared in chart.
we can see that; it has given a bounce back from Support of 1080-1100 Trendline.
wait for a Halt or retrace candle and then enter with SL and Targets.
Expected momentum is shared in chart.
免责声明
这些信息和出版物并不意味着也不构成TradingView提供或认可的金融、投资、交易或其它类型的建议或背书。请在使用条款阅读更多信息。
免责声明
这些信息和出版物并不意味着也不构成TradingView提供或认可的金融、投资、交易或其它类型的建议或背书。请在使用条款阅读更多信息。