搜索
产品
社区
市场
经纪商
更多
CN
开始
Indraprastha Gas Limited
做多
2022年4月18日
IGL Chart
2
获取这个图表
获取这个图表
103
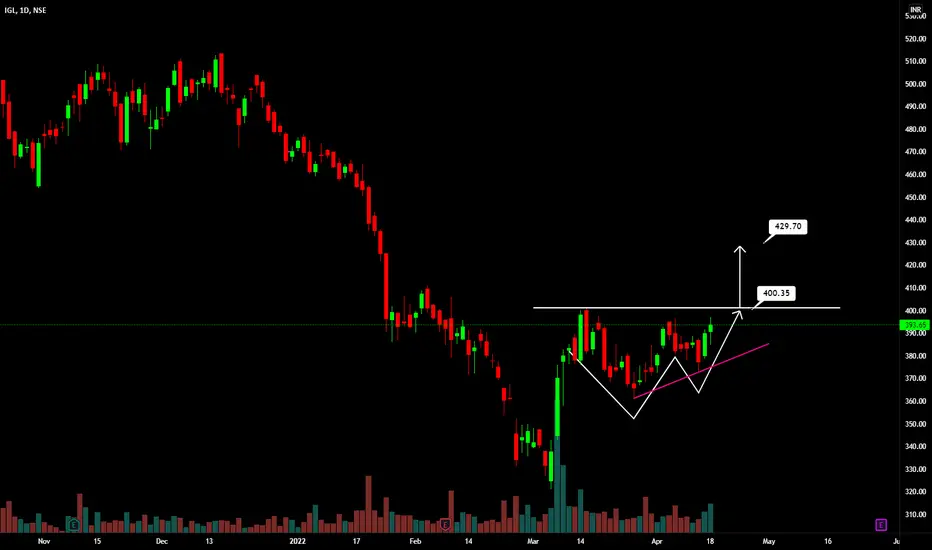
Above chart is a daily chart of IGL.
Double bottom pattern with higher low is visible.
Breaking above 400 will active the trade.
Potential target 430.
nmcapital44
关注
更多:
Chart Patterns
doublebottomreversal
Technical Indicators
Trend Analysis
免责声明
这些信息和出版物并不意味着也不构成TradingView提供或认可的金融、投资、交易或其它类型的建议或背书。请在
使用条款
阅读更多信息。
Chart Patterns
doublebottomreversal
Technical Indicators
Trend Analysis
nmcapital44
关注
更多:
免责声明
这些信息和出版物并不意味着也不构成TradingView提供或认可的金融、投资、交易或其它类型的建议或背书。请在
使用条款
阅读更多信息。