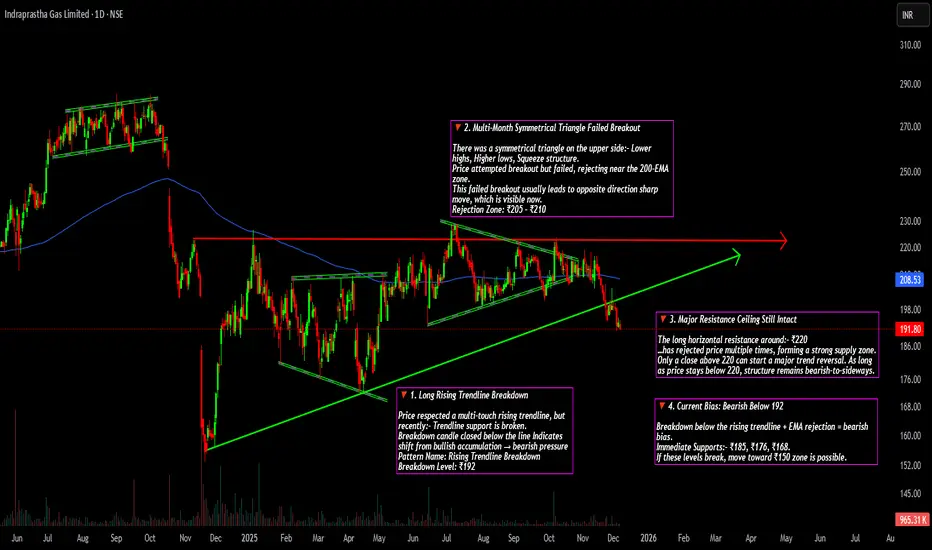
🔻 1. Long Rising Trendline Breakdown
Price respected a multi-touch rising trendline, but recently:- Trendline support is broken.
Breakdown candle closed below the line Indicates shift from bullish accumulation → bearish pressure
Pattern Name: Rising Trendline Breakdown
Breakdown Level: ₹192.
🔻 2. Multi-Month Symmetrical Triangle Failed Breakout
There was a symmetrical triangle on the upper side:- Lower highs, Higher lows, Squeeze structure.
Price attempted breakout but failed, rejecting near the 200-EMA zone.
This failed breakout usually leads to opposite direction sharp move, which is visible now.
Rejection Zone: ₹205 – ₹210.
🔻 3. Major Resistance Ceiling Still Intact
The long horizontal resistance around:- ₹220
…has rejected price multiple times, forming a strong supply zone. Only a close above 220 can start a major trend reversal. As long as price stays below 220, structure remains bearish-to-sideways.
🔻 4. Current Bias: Bearish Below 192
Breakdown below the rising trendline + EMA rejection = bearish bias.
Immediate Supports:- ₹185, ₹176, ₹168.
If these levels break, move toward ₹150 zone is possible.
免责声明
这些信息和出版物并非旨在提供,也不构成TradingView提供或认可的任何形式的财务、投资、交易或其他类型的建议或推荐。请阅读使用条款了解更多信息。
免责声明
这些信息和出版物并非旨在提供,也不构成TradingView提供或认可的任何形式的财务、投资、交易或其他类型的建议或推荐。请阅读使用条款了解更多信息。