A technical review of  IMOS reveals a constructive setup following its recent earnings report, suggesting the potential for a continued upward trajectory. The convergence of a fundamental catalyst and a recognizable bullish pattern provides a framework for assessing future price movement.
1. Fundamental Catalyst: Solid Earnings Report
The company's earnings release on Tuesday, November 11th, served as a significant fundamental catalyst. Your characterization that the company "did okay" is interpreted as the results meeting or modestly exceeding market expectations. This positive news has likely instilled confidence, providing a fundamental underpinning for the current price action and the formation of the subsequent bullish pattern.
2. Pattern Analysis: The Emerging Bull Flag
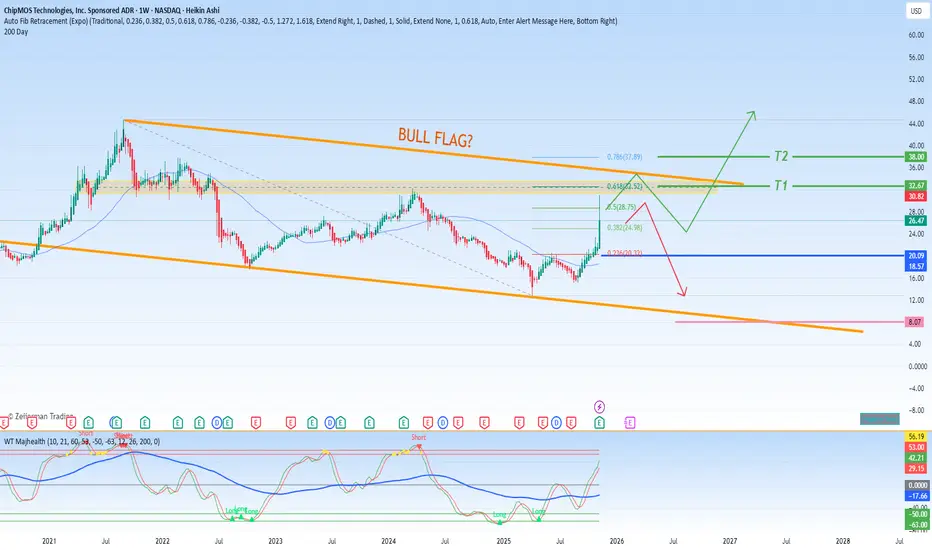
The post-earnings price action is potentially forming a Bull Flag pattern, which is a common and often reliable continuation signal.
Pattern Structure: This pattern typically consists of a sharp upward move (the "flagpole"), fueled in this case by the positive earnings reaction, followed by a period of sideways or slightly downward-sloping consolidation (the "flag") on declining volume.
Current Status: The stock appears to be in this consolidation phase. The "flag" represents a brief pause where the market digests the recent gains before deciding on the next direction. A breakout above the upper boundary of this flag would confirm the pattern and signal the resumption of the prior uptrend.
3. Fibonacci Framework: Defining Risk and Reward
Applying Fibonacci retracement levels to the recent upswing (likely from pre-earnings to the post-earnings high) provides a mathematical basis for setting profit targets and a strategic stop-loss.
Support & Stop-Loss (The 0.236 Level):
The 0.236 Fibonacci level at $20.32 represents a shallow and healthy retracement. This level should now be viewed as a key support zone. From a risk management perspective, a decisive break below $20.32 would call the bull flag thesis into question and could trigger a deeper pullback. Therefore, this level serves as a logical line for a protective stop-loss.
Profit-Taking Targets (Upside Objectives):
The measured move of a bull flag often projects a move equal to the length of the initial flagpole. The Fibonacci extension levels provide precise targets for this projection. Our primary take-profit zones are:
Primary Target (0.618): $32.52. This is a standard first profit-taking level and often coincides with the flag pattern's minimum measured move target.
Extended Target (0.786): $37.89. If buying pressure is particularly strong and the breakout is powerful, a move toward this second, higher target becomes probable. This represents a more ambitious take-profit zone.
Synthesis and Strategic Outlook
In summary,IMOS is exhibiting the technical hallmarks of a healthy uptrend taking a breather. The positive earnings report provided the initial thrust, and the current consolidation forms a potential launchpad for the next leg higher.
Key Levels to Watch:
Confirmation Trigger: A decisive breakout above the upper trendline of the developing bull flag pattern.
Support/Stop-Loss: $20.32 (0.236 Fib). Hold for continuation; break for invalidation.
Profit Target 1: $32.52 (0.618 Fib)
Profit Target 2: $37.89 (0.786 Fib)
The strategy is to monitor the price action at the flag's resistance and the key Fibonacci support. A successful breakout above resistance would activate the bullish targets, while a failure to hold $20.32 would suggest a need to re-evaluate the bullish premise.
1. Fundamental Catalyst: Solid Earnings Report
The company's earnings release on Tuesday, November 11th, served as a significant fundamental catalyst. Your characterization that the company "did okay" is interpreted as the results meeting or modestly exceeding market expectations. This positive news has likely instilled confidence, providing a fundamental underpinning for the current price action and the formation of the subsequent bullish pattern.
2. Pattern Analysis: The Emerging Bull Flag
The post-earnings price action is potentially forming a Bull Flag pattern, which is a common and often reliable continuation signal.
Pattern Structure: This pattern typically consists of a sharp upward move (the "flagpole"), fueled in this case by the positive earnings reaction, followed by a period of sideways or slightly downward-sloping consolidation (the "flag") on declining volume.
Current Status: The stock appears to be in this consolidation phase. The "flag" represents a brief pause where the market digests the recent gains before deciding on the next direction. A breakout above the upper boundary of this flag would confirm the pattern and signal the resumption of the prior uptrend.
3. Fibonacci Framework: Defining Risk and Reward
Applying Fibonacci retracement levels to the recent upswing (likely from pre-earnings to the post-earnings high) provides a mathematical basis for setting profit targets and a strategic stop-loss.
Support & Stop-Loss (The 0.236 Level):
The 0.236 Fibonacci level at $20.32 represents a shallow and healthy retracement. This level should now be viewed as a key support zone. From a risk management perspective, a decisive break below $20.32 would call the bull flag thesis into question and could trigger a deeper pullback. Therefore, this level serves as a logical line for a protective stop-loss.
Profit-Taking Targets (Upside Objectives):
The measured move of a bull flag often projects a move equal to the length of the initial flagpole. The Fibonacci extension levels provide precise targets for this projection. Our primary take-profit zones are:
Primary Target (0.618): $32.52. This is a standard first profit-taking level and often coincides with the flag pattern's minimum measured move target.
Extended Target (0.786): $37.89. If buying pressure is particularly strong and the breakout is powerful, a move toward this second, higher target becomes probable. This represents a more ambitious take-profit zone.
Synthesis and Strategic Outlook
In summary,
Key Levels to Watch:
Confirmation Trigger: A decisive breakout above the upper trendline of the developing bull flag pattern.
Support/Stop-Loss: $20.32 (0.236 Fib). Hold for continuation; break for invalidation.
Profit Target 1: $32.52 (0.618 Fib)
Profit Target 2: $37.89 (0.786 Fib)
The strategy is to monitor the price action at the flag's resistance and the key Fibonacci support. A successful breakout above resistance would activate the bullish targets, while a failure to hold $20.32 would suggest a need to re-evaluate the bullish premise.
免责声明
这些信息和出版物并非旨在提供,也不构成TradingView提供或认可的任何形式的财务、投资、交易或其他类型的建议或推荐。请阅读使用条款了解更多信息。