As is ABSOLUTELY always the case, the time comes when a previous high becomes the new low — and this coin is no exception.
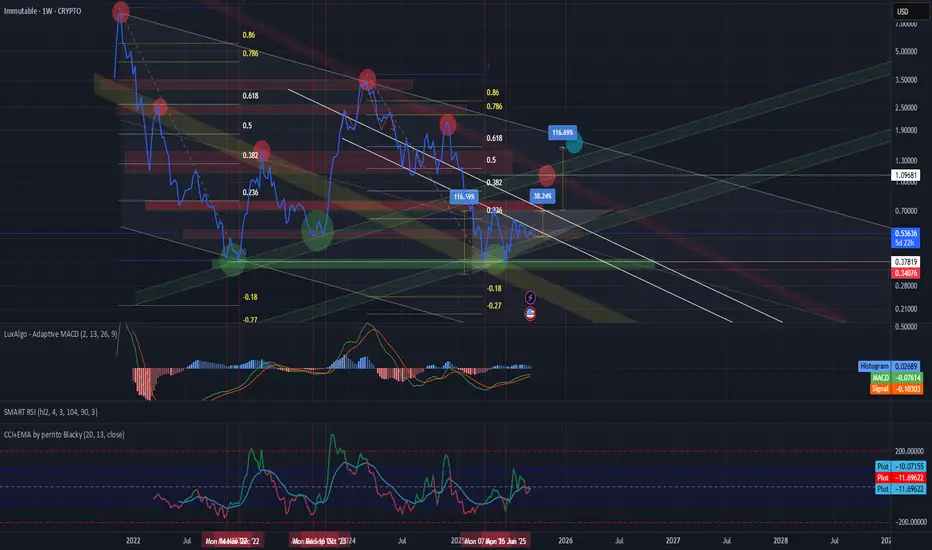
Pay attention to the yellow channel: every reversal has been marked by two key points, just like the current one — highlighted with green circles.
A potential inverted triangle with a right angle may have formed on the chart, suggesting a move toward the upper boundary of the global descending channel. Percentage targets are indicated.
Key zones are also marked — previous resistance levels that are likely to act as support going forward.
A new channel may already be forming, guiding price toward the outlined targets.
Fibonacci retracement shows confluence around the 0.5–0.618 levels, just like in the previous cycle.
MACD indicates ongoing accumulation, while CCI shows that highs are still far off.
I hope everything is clear.
相关出版物
免责声明
这些信息和出版物并不意味着也不构成TradingView提供或认可的金融、投资、交易或其它类型的建议或背书。请在使用条款阅读更多信息。