📌 Key Data & Trend Context
Recent price: around ₹ 404 (or in the ~₹ 401–409 range depending on source/time).
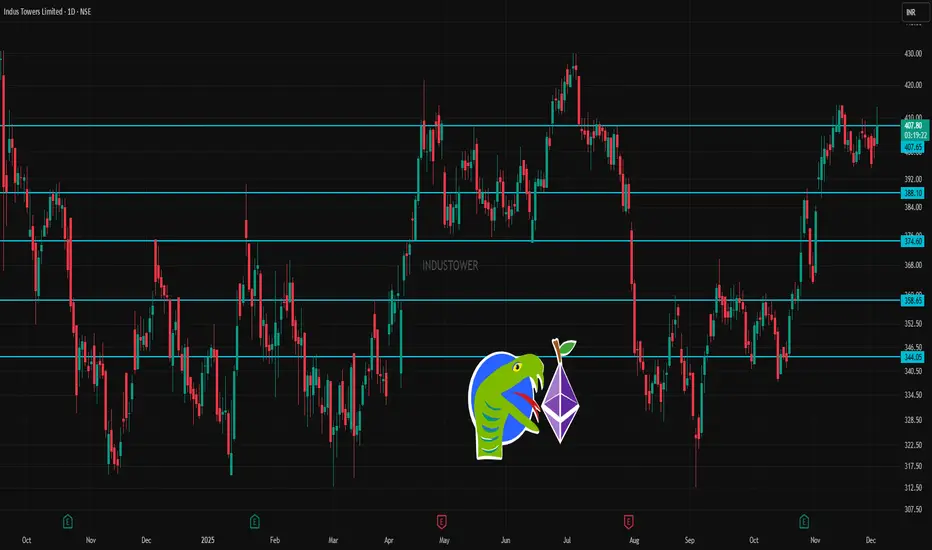
52‑week range: Low ≈ ₹ 312.55, High ≈ ₹ 430.00.
According to moving averages (short‑, mid‑ & long‑term), trend is marked “outperform” / bullish.
✅ What This Suggests (in 1‑day / Short-Term Context)
As long as price holds above ₹ 388–392, the near‑term trend remains stable / bullish.
A close above ₹ 405–408 on decent volume may signal a bullish breakout — could push toward ₹ 424–438 range.
On a drop below ₹ 338–346, the stock could weaken significantly — suggesting caution or a bearish tilt.
Given moving averages (short + mid + long) are in bullish alignment, intermediate‑term bias remains positive.
Recent price: around ₹ 404 (or in the ~₹ 401–409 range depending on source/time).
52‑week range: Low ≈ ₹ 312.55, High ≈ ₹ 430.00.
According to moving averages (short‑, mid‑ & long‑term), trend is marked “outperform” / bullish.
✅ What This Suggests (in 1‑day / Short-Term Context)
As long as price holds above ₹ 388–392, the near‑term trend remains stable / bullish.
A close above ₹ 405–408 on decent volume may signal a bullish breakout — could push toward ₹ 424–438 range.
On a drop below ₹ 338–346, the stock could weaken significantly — suggesting caution or a bearish tilt.
Given moving averages (short + mid + long) are in bullish alignment, intermediate‑term bias remains positive.
相关出版物
免责声明
这些信息和出版物并非旨在提供,也不构成TradingView提供或认可的任何形式的财务、投资、交易或其他类型的建议或推荐。请阅读使用条款了解更多信息。