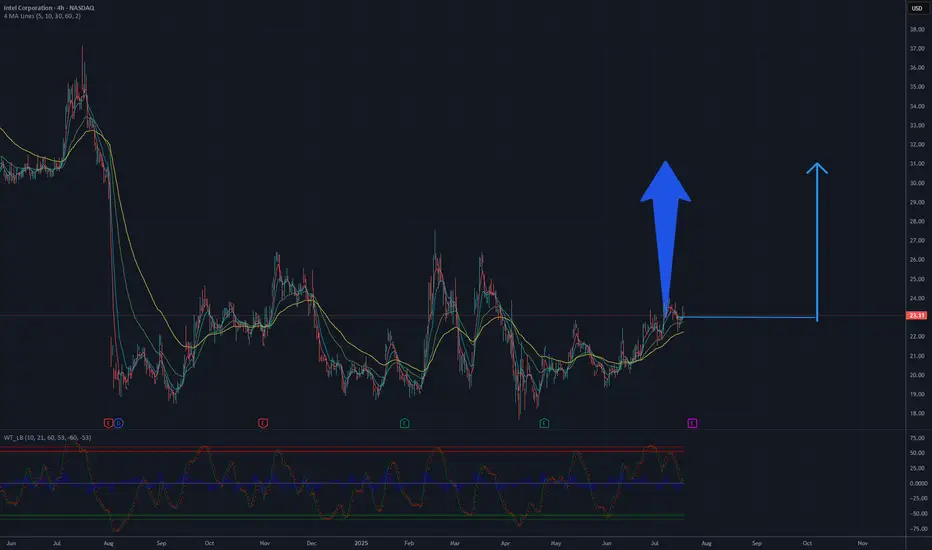
The Intel Corporation (INTC) chart on NASDAQ illustrates the stock price dynamics from 2024 to July 2025. Initially, the price rose to a peak in the first half of 2024, followed by a significant decline, reaching its lowest point around 24 USD by the end of 2024. Since then, the price has been consolidating in the 24-26 USD range, which may signal preparation for a potential rebound.
The moving averages (MA) on the chart suggest a gradual convergence of lines, indicating a possible turning point. Oscillators at the bottom of the chart, such as RSI, may indicate oversold conditions, supporting the hypothesis of an upward move. The 26 USD level acts as a strong support, and breaking above 28-30 USD could pave the way to 34 USD, a previous resistance level.
A potential rise to 34 USD is plausible if the price maintains momentum and breaks through the resistance with sufficient volume.
Potential TP: 32 USD
交易结束:到达目标
Target done !! 免责声明
这些信息和出版物并非旨在提供,也不构成TradingView提供或认可的任何形式的财务、投资、交易或其他类型的建议或推荐。请阅读使用条款了解更多信息。
免责声明
这些信息和出版物并非旨在提供,也不构成TradingView提供或认可的任何形式的财务、投资、交易或其他类型的建议或推荐。请阅读使用条款了解更多信息。