📈
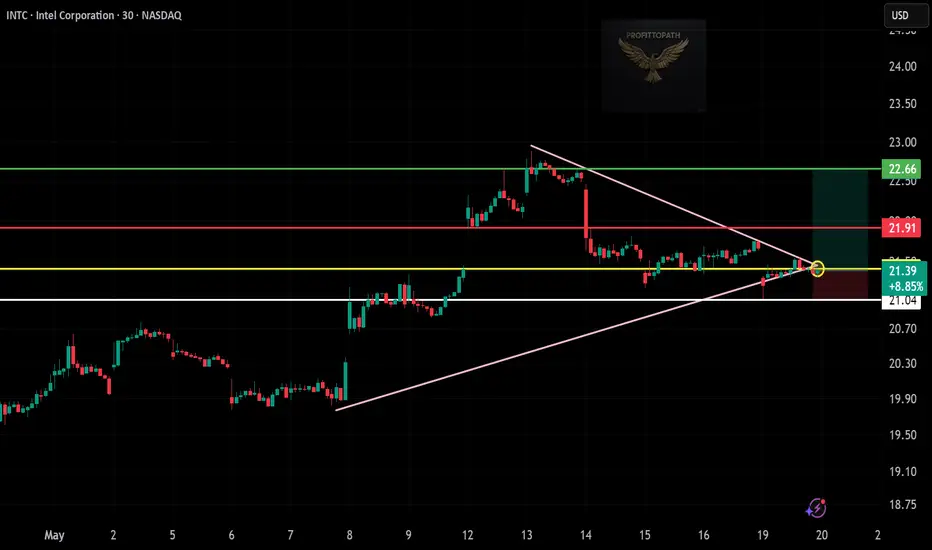
Current Price: $21.39
Pattern: Symmetrical triangle breakout (neutral-to-bullish bias)
Entry Zone: ~$21.39 (breakout confirmation)
Stop-Loss (SL): $21.04 (below triangle base/support)
Targets:
TP1: $21.91 (resistance – red line)
TP2: $22.66 (major resistance zone – green line)
🧠 Technical Highlights
Price has broken out of a tightening triangle pattern.
Yellow resistance flipped to support.
Volume not shown clearly but breakout candle shows good body.
Risk/Reward: Favorable at ~1:2 if targets hold.
🎯 Bias:
Bullish above $21.04.
Neutral or bearish below this zone.
免责声明
这些信息和出版物并不意味着也不构成TradingView提供或认可的金融、投资、交易或其它类型的建议或背书。请在使用条款阅读更多信息。
免责声明
这些信息和出版物并不意味着也不构成TradingView提供或认可的金融、投资、交易或其它类型的建议或背书。请在使用条款阅读更多信息。