📊 Key Technical Indicators
Moving Averages: The stock is trading below its 5-day, 50-day, and 200-day moving averages, all indicating a sell trend.
Relative Strength Index (RSI): The 14-day RSI stands at 39.62, suggesting the stock is in a neutral to bearish condition.
MACD: The MACD is negative, reinforcing the bearish trend.
📈 Support and Resistance Levels
Support Levels: ₹37.84 (weekly pivot), ₹37.56 (short-term support), ₹36.07 (lower range of horizontal trend).
Resistance Levels: ₹39.75 (weekly pivot), ₹39.59 (near-term resistance), ₹41.08 (upper range of horizontal trend).
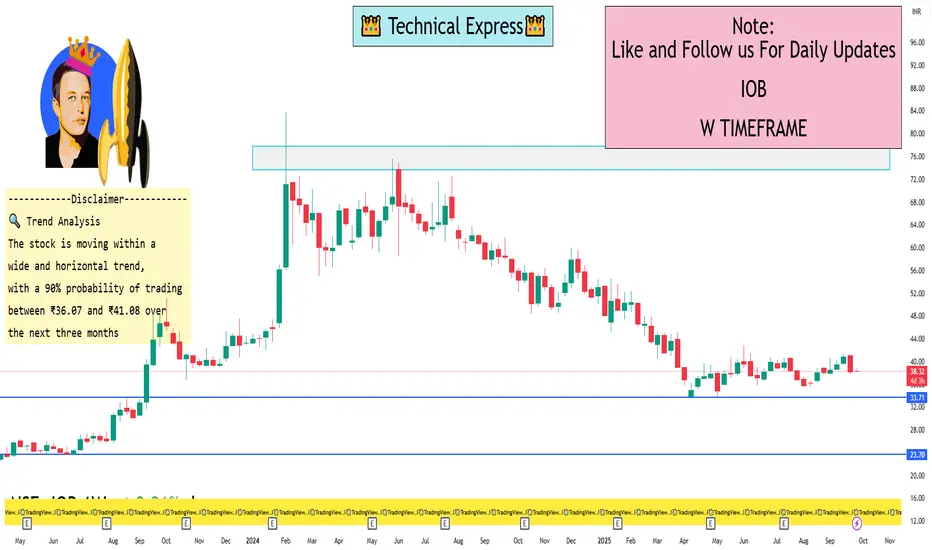
🔍 Trend Analysis
The stock is moving within a wide and horizontal trend, with a 90% probability of trading between ₹36.07 and ₹41.08 over the next three months.
⚠️ Outlook
The prevailing trend is bearish, with no significant positive signals at the moment. A break above the resistance levels could indicate a potential reversal, but currently, the stock remains under pressure.
Moving Averages: The stock is trading below its 5-day, 50-day, and 200-day moving averages, all indicating a sell trend.
Relative Strength Index (RSI): The 14-day RSI stands at 39.62, suggesting the stock is in a neutral to bearish condition.
MACD: The MACD is negative, reinforcing the bearish trend.
📈 Support and Resistance Levels
Support Levels: ₹37.84 (weekly pivot), ₹37.56 (short-term support), ₹36.07 (lower range of horizontal trend).
Resistance Levels: ₹39.75 (weekly pivot), ₹39.59 (near-term resistance), ₹41.08 (upper range of horizontal trend).
🔍 Trend Analysis
The stock is moving within a wide and horizontal trend, with a 90% probability of trading between ₹36.07 and ₹41.08 over the next three months.
⚠️ Outlook
The prevailing trend is bearish, with no significant positive signals at the moment. A break above the resistance levels could indicate a potential reversal, but currently, the stock remains under pressure.
I built a Buy & Sell Signal Indicator with 85% accuracy.
📈 Get access via DM or
WhatsApp: wa.link/d997q0
Contact - +91 76782 40962
| Email: techncialexpress@gmail.com
| Script Coder | Trader | Investor | From India
📈 Get access via DM or
WhatsApp: wa.link/d997q0
Contact - +91 76782 40962
| Email: techncialexpress@gmail.com
| Script Coder | Trader | Investor | From India
相关出版物
免责声明
这些信息和出版物并非旨在提供,也不构成TradingView提供或认可的任何形式的财务、投资、交易或其他类型的建议或推荐。请阅读使用条款了解更多信息。