- Unveil the mesmerizing journey of Indian Oil Corp Ltd (IOC) on this captivating chart!
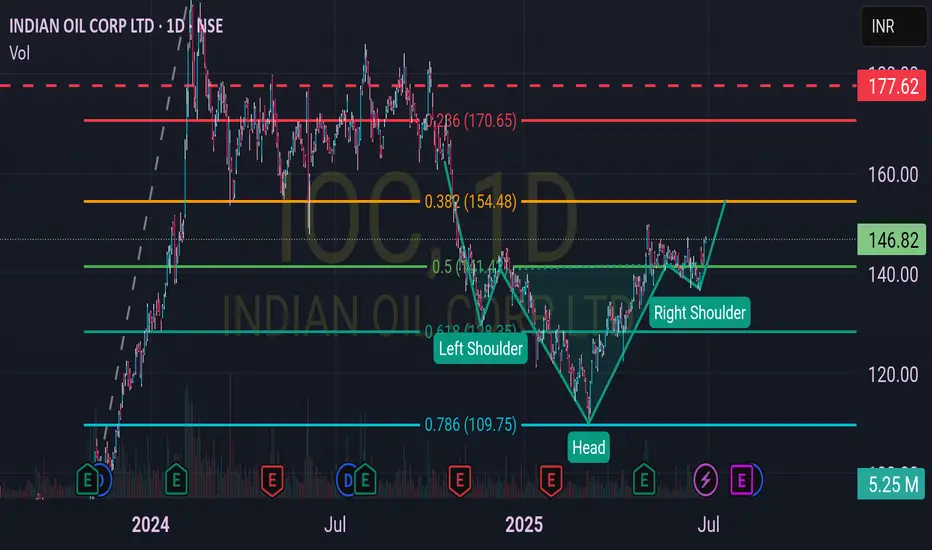
- Behold the Fibonacci levels, meticulously drawn two months ago, revealing a fascinating truth.
- Witness the price action align flawlessly with these golden ratios, a trader's dream come true.
- Marvel at the emerging head and shoulder pattern, hinting at a potential trend reversal.
- Anticipate an exhilarating uptrend as the pattern nears completion, sparking excitement.
- Strategize with a trailing stop from entry, safeguarding your gains with precision.
- Embrace proper risk management to navigate this thrilling market adventure.
- The 0.618 level at ₹154.48 and 0.786 at ₹109.75 have held strong, guiding the price.
- The current price of ₹146.73 teases a breakout, aligning with the right shoulder.
- Prepare for an upward surge, blending Fibonacci magic with pattern perfection!
免责声明
这些信息和出版物并不意味着也不构成TradingView提供或认可的金融、投资、交易或其它类型的建议或背书。请在使用条款阅读更多信息。
免责声明
这些信息和出版物并不意味着也不构成TradingView提供或认可的金融、投资、交易或其它类型的建议或背书。请在使用条款阅读更多信息。