The IOTA/USDT (1W) chart is now entering a critical phase, potentially defining the major market direction heading into 2026.
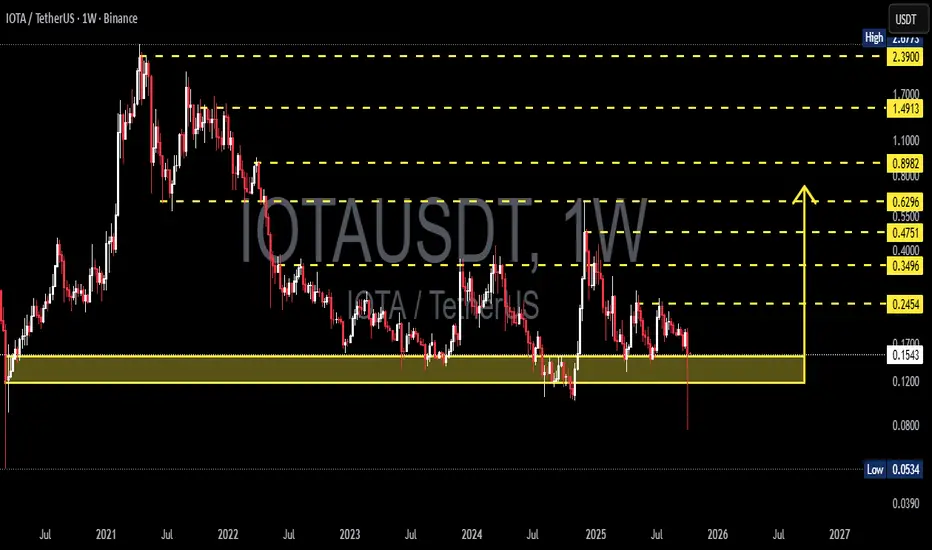
Price is currently hovering right above the key demand zone between $0.15 and $0.12 — a level that has acted as a multi-year support floor since 2022.
Interestingly, the chart shows a long wick below the yellow box, followed by a strong recovery back inside the zone — a classic sign of liquidity absorption or a liquidity grab. This pattern often signals smart money accumulation and can mark the beginning of a macro reversal if confirmed by strong bullish weekly candles and increasing volume.
However, on the broader structure, the market still maintains a series of lower highs since its 2021 peak — meaning that sellers continue to dominate the long-term structure. Therefore, a confirmed breakout remains essential before assuming any sustainable trend reversal.
---
Technical Structure & Key Levels
Major Support (Demand Zone): $0.15 – $0.12
→ A historically strong area that has been tested multiple times over the past three years. How price reacts here will decide whether this is another accumulation phase or a breakdown setup.
Immediate Resistance: $0.245
Mid-Term Resistances: $0.349 → $0.475 → $0.629
High-Value Targets: $0.898 → $1.491 → $2.39
Historical Low: $0.0534 (extreme capitulation level if breakdown occurs).
---
Bullish Scenario — Potential Rebound from the Accumulation Zone
If the weekly candle closes above $0.15 and shows a continuation pattern with increasing volume, a major rebound phase could begin.
Step-by-step targets:
1. $0.245 → initial confirmation of reversal
2. $0.35 – $0.47 → mid-term swing targets
3. $0.63 – $0.89 → broader recovery range
A decisive breakout above $0.245 would mark a shift from bearish to neutral-bullish structure, opening the door for a sustained recovery phase into 2026.
---
Bearish Scenario — Breakdown Toward Historical Lows
If the price closes below $0.12 on a weekly timeframe, the bearish scenario becomes dominant.
Next potential downside targets:
$0.08 → psychological support
$0.0534 → historical capitulation zone
Failure to defend this range would indicate that buyers have lost control, likely triggering a new macro downtrend that revisits multi-year lows.
---
Conclusion
The $0.15–$0.12 zone remains the key battlefield between long-term buyers and sellers.
A successful rebound could mark the start of a new accumulation phase, while a clear breakdown would confirm another leg of the bearish cycle.
The upcoming weekly close will be crucial to determine which side gains dominance.
---
#IOTA #IOTAUSDT #CryptoAnalysis #TechnicalAnalysis #Altcoin #CryptoTrading #SupportResistance #CryptoBullish #CryptoBearish #MarketStructure #PriceAction #SwingTrade
✅ Get Free Signals! Join Our Telegram Channel Here: t.me/TheCryptoNuclear
✅ Twitter: twitter.com/crypto_nuclear
✅ Join Bybit : partner.bybit.com/b/nuclearvip
✅ Benefits : Lifetime Trading Fee Discount -50%
✅ Twitter: twitter.com/crypto_nuclear
✅ Join Bybit : partner.bybit.com/b/nuclearvip
✅ Benefits : Lifetime Trading Fee Discount -50%
免责声明
这些信息和出版物并不意味着也不构成TradingView提供或认可的金融、投资、交易或其它类型的建议或背书。请在使用条款阅读更多信息。