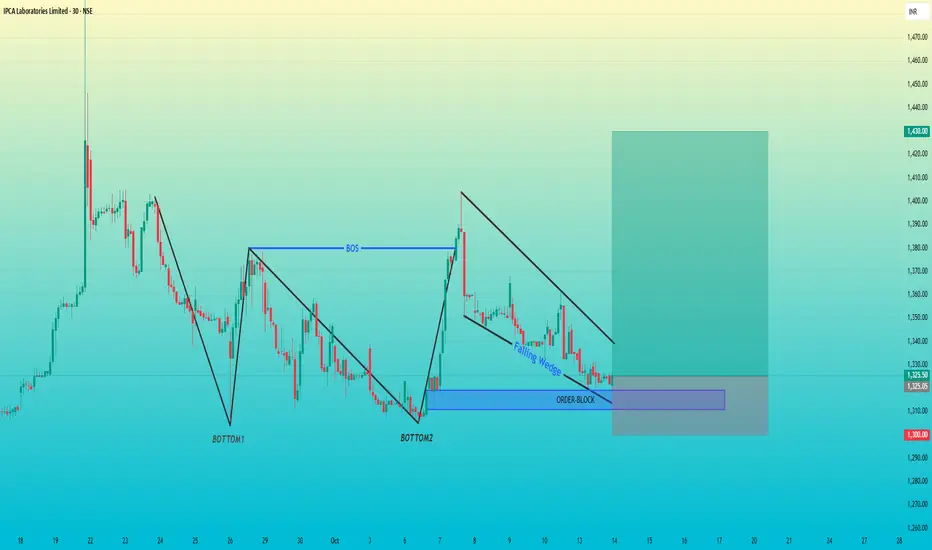
Chart Overview
Pattern: Falling Wedge inside a confirmed bullish structure
Structure Break: BOS (Break of Structure) already confirmed
Key Levels:
Order Block Zone: Around ₹1300–₹1310
Current Price: ₹1325
Target Zone: ₹1430
Stop-Loss: Below ₹1300
Technical Breakdown
1. Double Bottom
The formation of Bottom1 and Bottom2 shows a strong demand base.
The BOS (Break of Structure) after Bottom2 confirms that buyers took control.
2. Falling Wedge Pattern
After the BOS, the price is consolidating in a Falling Wedge, which is typically a bullish continuation pattern.
Price respecting the wedge boundaries suggests compression — a breakout to the upside can trigger momentum.
3. Order Block Zone
The blue rectangular area marks a bullish order block from the last strong bullish rally.
Price has retraced back into this OB, creating an ideal entry point if bullish rejection appears.
4. Trade Setup
Entry: Near ₹1320–₹1325
Stop-Loss: Below ₹1300 (OB invalidation)
Target: ₹1430
RR Ratio: ≈ 1:4
交易结束:到达止损
免责声明
这些信息和出版物并非旨在提供,也不构成TradingView提供或认可的任何形式的财务、投资、交易或其他类型的建议或推荐。请阅读使用条款了解更多信息。