📉 Today’s Price Action
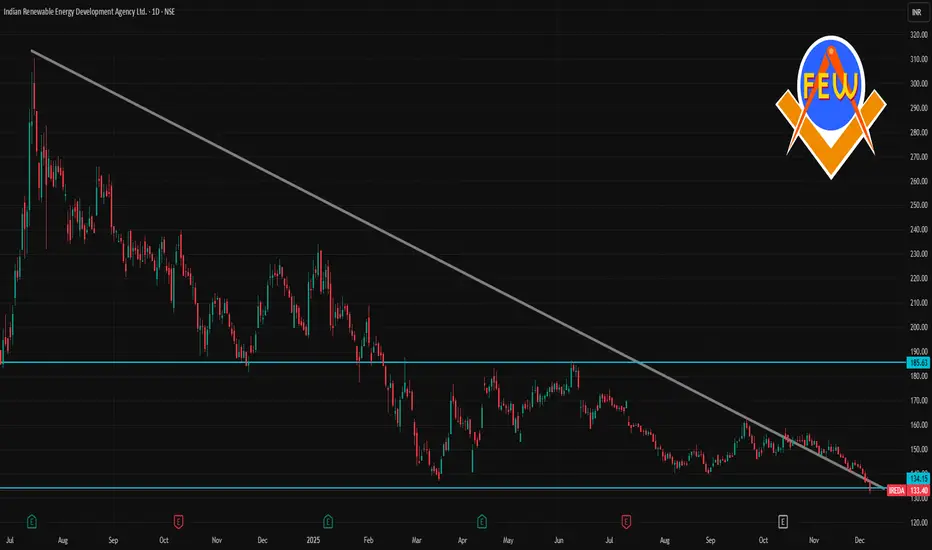
Last traded price: ₹ 133.40
Day’s range: ₹ 132.00 – ₹ 137.29
Change vs previous close: – ₹ 3.35 (–2.45%)
📊 Key Context & Technical Snapshot
Metric / Indicator Value / Observation
52-week range ₹ 132.00 — ₹ 234.29
Relative valuation P/E ~ 21.7 ×
Market cap ~ ₹ 37,475 Cr
Recent momentum 1-week: –6.65%, 1-month: –11.66%
Volatility (ATR) ATR (5-day) ≈ ₹ 3.4
Interpretation (short-term / 1-day):
The stock is near its 52-week low zone — so the current level (~₹133) is close to its recent bottom band.
The drop today suggests selling pressure, but the intraday range shows some trading / bounce between ₹132–₹137.
Given the volatility (as indicated by ATR) and recent downward momentum, the stock looks “soft” in the very short term.
相关出版物
免责声明
这些信息和出版物并非旨在提供,也不构成TradingView提供或认可的任何形式的财务、投资、交易或其他类型的建议或推荐。请阅读使用条款了解更多信息。