📈 Recent 1-Week Performance
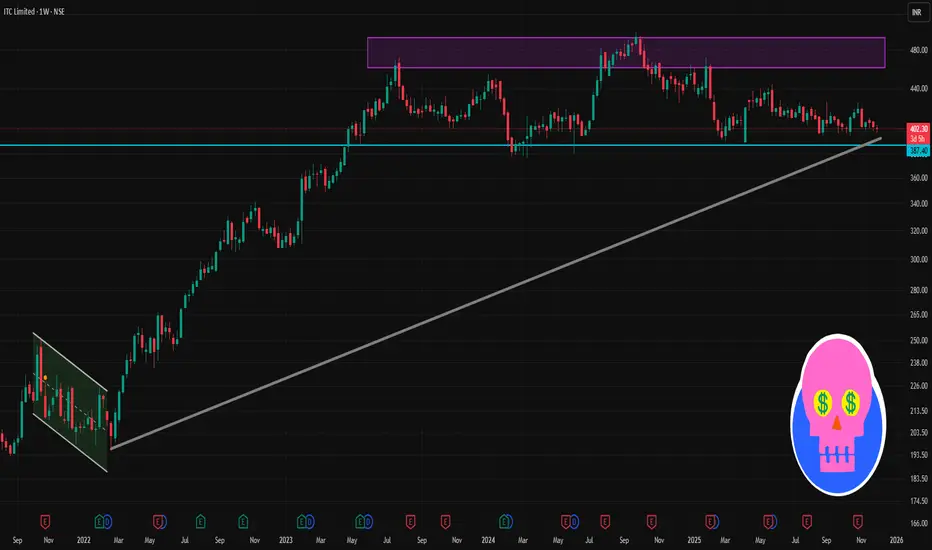
Around Dec 2 2025, ITC is trading ~ ₹403–404.
Over last 1 week, the stock has moved up roughly +0.5 % to +0.6 % according to available weekly return data.
The 7-day exponential moving average (EMA) is also near ~₹402 — which suggests price is close to short-term average, not showing sharp divergence yet.
✅ What Price Action Would Suggest
If price holds above ₹402–403 and breaks above ₹405–407, that could indicate short-term bullish bias.
If price falls below ₹400, watch for possible further drop — support zone is ~₹398; a sharp break could shift short-term sentiment negative.
If price consolidates between ~₹402 and ~₹407, expect range-bound behaviour until a clear breakout or breakdown.
相关出版物
免责声明
这些信息和出版物并非旨在提供,也不构成TradingView提供或认可的任何形式的财务、投资、交易或其他类型的建议或推荐。请阅读使用条款了解更多信息。