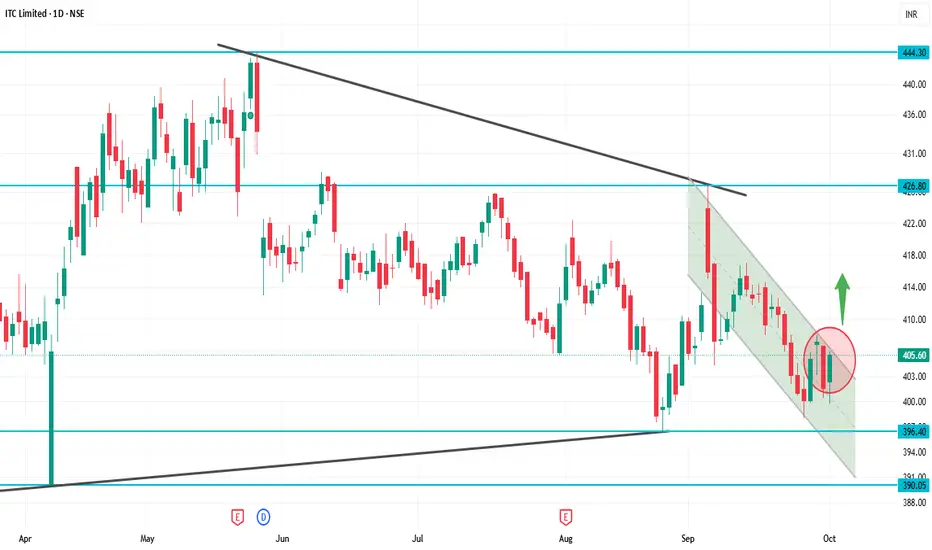
Current Price: ₹405.60
52-Week High: ₹524.35
52-Week Low: ₹390.15
Trend: Downward — trading below 5, 20, 50, 100, 200-day moving averages
Daily Chart Insights
Price below moving averages → bearish trend.
RSI & MACD → weak momentum, signaling short-term selling pressure.
Support zone at ₹390–₹400 → critical; a break below can push price down to ₹370–₹380.
Resistance at ₹420–₹430 → a strong close above may signal trend reversal.
Strategy / Outlook
Bearish Bias: Short-term trend is downward.
Buying Opportunity: Near support zones (₹390–₹400) if it holds.
Bullish Trigger: Close above ₹430 with strong volume indicates potential reversal.
Risk Management: Use stop-loss below critical support zones.
相关出版物
免责声明
这些信息和出版物并非旨在提供,也不构成TradingView提供或认可的任何形式的财务、投资、交易或其他类型的建议或推荐。请阅读使用条款了解更多信息。