ITDC (India Tourism Development Corp Ltd) Weekly Chart Analysis
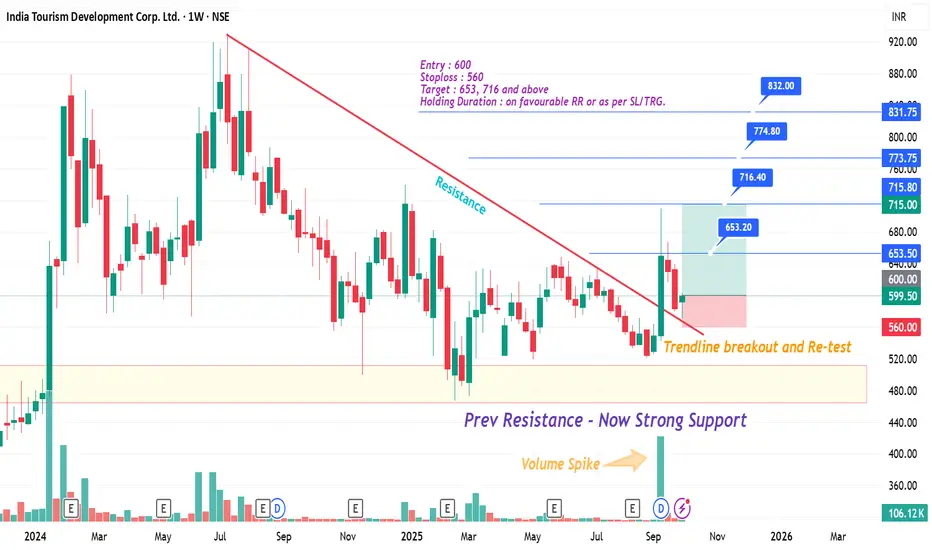
The stock has shown a trendline breakout and successful retest with strong volume support, indicating bullish momentum building up.
✅ Entry: 600
❌ Stoploss: 560
🎯 Targets: 653, 716, 774, 832
🔹 Previous resistance zone is now acting as strong support.
🔹 Volume spike confirms buying interest.
🔹 Risk-Reward looks favorable for positional traders.
This setup aligns with the tourism & hospitality sector’s ongoing revival and government focus on boosting domestic tourism.
Watchlist Addition 🚀
If momentum sustains, higher levels are possible in the medium term.
📰 Why should add :
Government initiatives to promote domestic tourism.
Upcoming festive and holiday season expected to boost travel demand.
Hospitality & tourism sector showing strong recovery trends post-pandemic.
#ITDC #Tourism #Hospitality #BreakoutStocks #SwingTrade #PositionalTrade #NSEStocks #ChartAnalysis #VolumeBreakout
免责声明
这些信息和出版物并不意味着也不构成TradingView提供或认可的金融、投资、交易或其它类型的建议或背书。请在使用条款阅读更多信息。
免责声明
这些信息和出版物并不意味着也不构成TradingView提供或认可的金融、投资、交易或其它类型的建议或背书。请在使用条款阅读更多信息。